

Browse guides
Metrics explained
What HRV, resting heart rate, VO₂ max and other numbers mean — and how devices measure them.
68 guides
Metrics explained
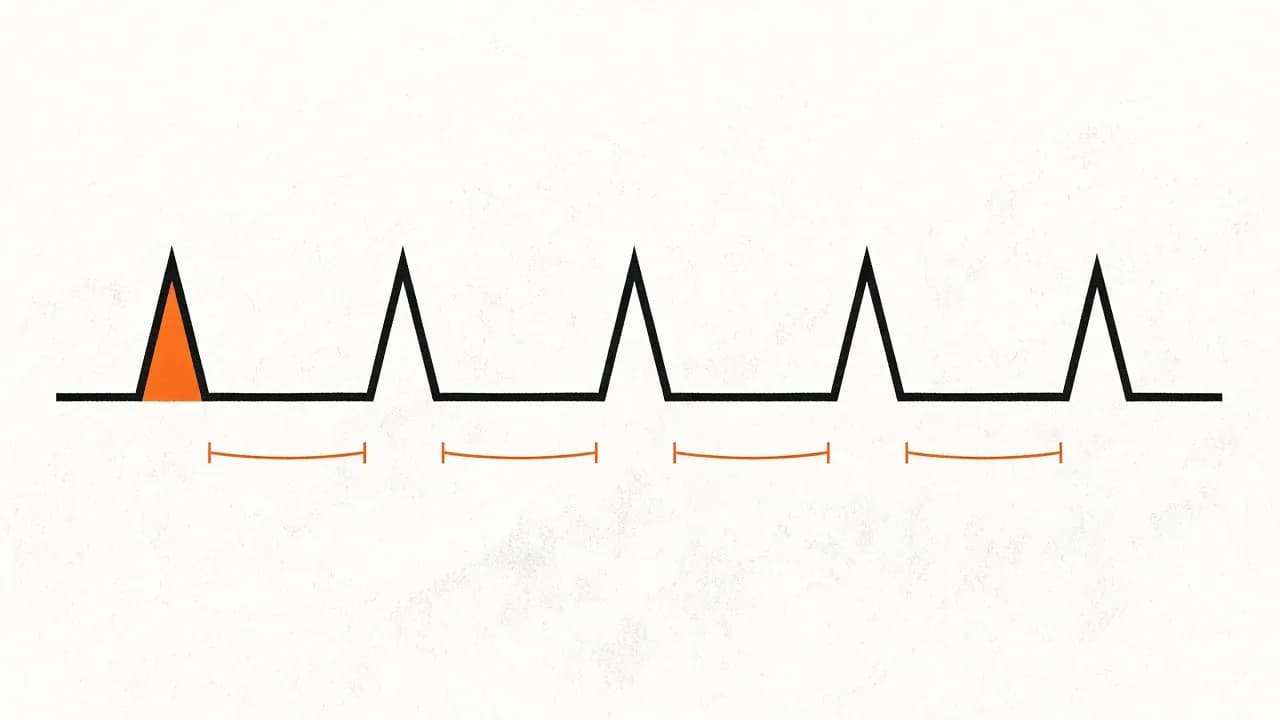
Normal heart rate variability (HRV) by age: RMSSD vs SDNN
6 min read

Metrics explained
Resting heart rate: normal ranges and what changes it
4 min read
Metrics explained
VO2 max: what it means and how to improve it
4 min read
Metrics explained
Heart rate zones explained: how to set and use them
4 min read

Metrics explained
Maximum heart rate: formulas, field tests and why age-based estimates fail
4 min read
Metrics explained
Blood oxygen (SpO2): what wearables measure and when to worry
4 min read

Metrics explained
Respiratory rate during sleep: a quiet early-warning signal
3 min read
Metrics explained
Skin temperature and temperature deviation: how to read them
3 min read
Metrics explained
Sleep stages: light, deep and REM sleep explained
4 min read

Metrics explained
How much sleep do you need? Sleep duration and sleep debt
4 min read
Metrics explained
Sleep efficiency: what percentage of time in bed you actually sleep
3 min read
Metrics explained
Sleep consistency: why a regular schedule beats a long lie-in
3 min read

Metrics explained
Sleep scores compared: Oura, Garmin, Polar, Withings and WHOOP
3 min read

Metrics explained
Daily steps: is 10,000 really the target?
3 min read
Metrics explained
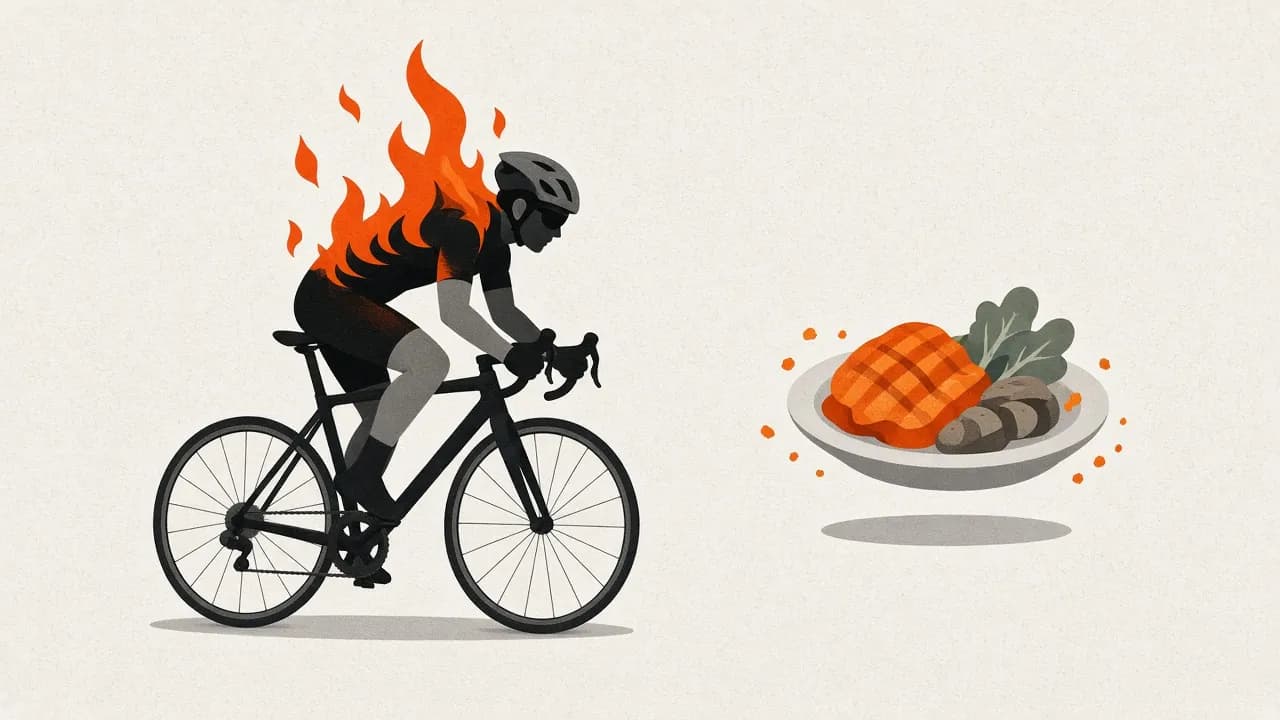
Calories burned: active, resting and total energy expenditure
4 min read
Metrics explained
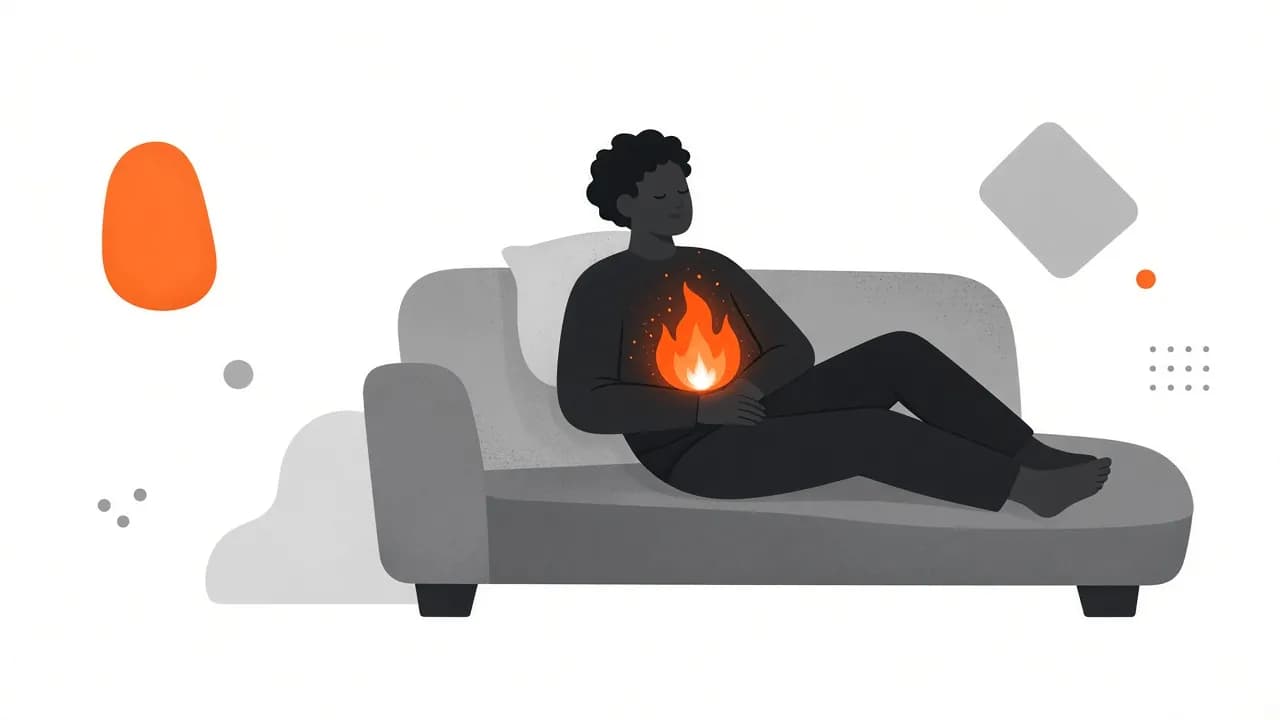
Basal metabolic rate (BMR): how many calories you burn at rest
3 min read
Metrics explained
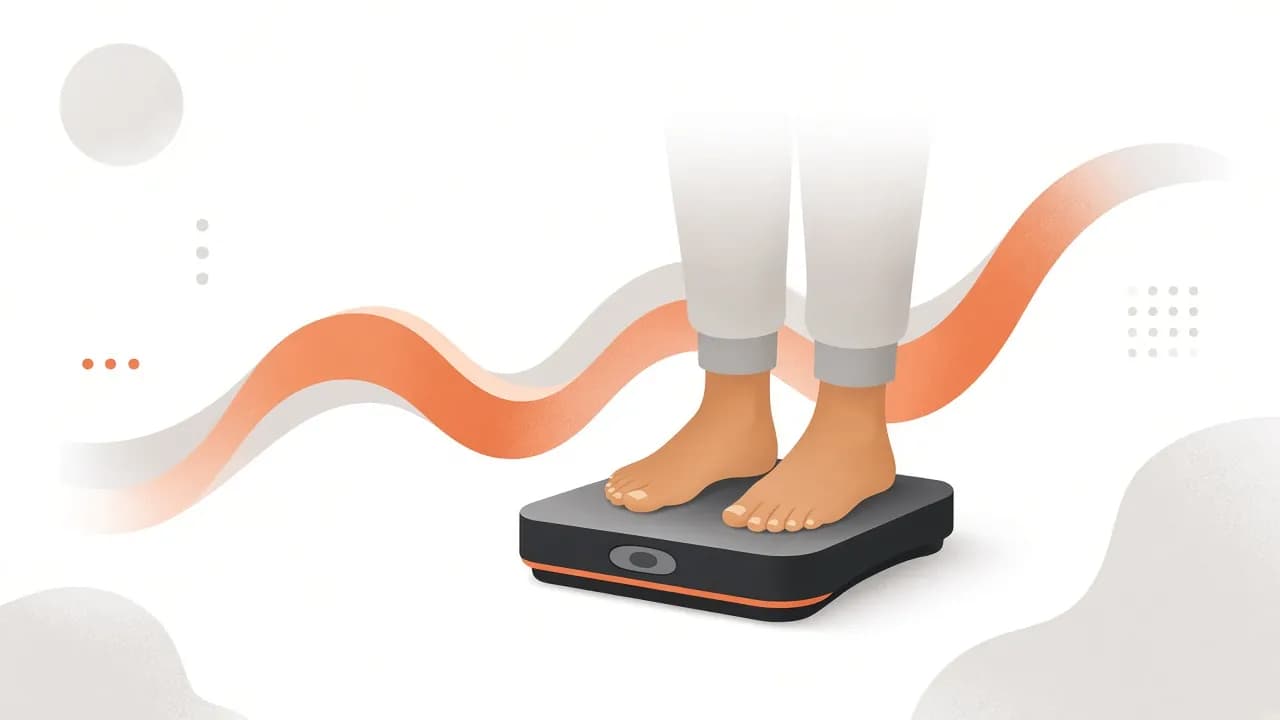
Body weight: why daily numbers jump and how to read the trend
3 min read
Metrics explained
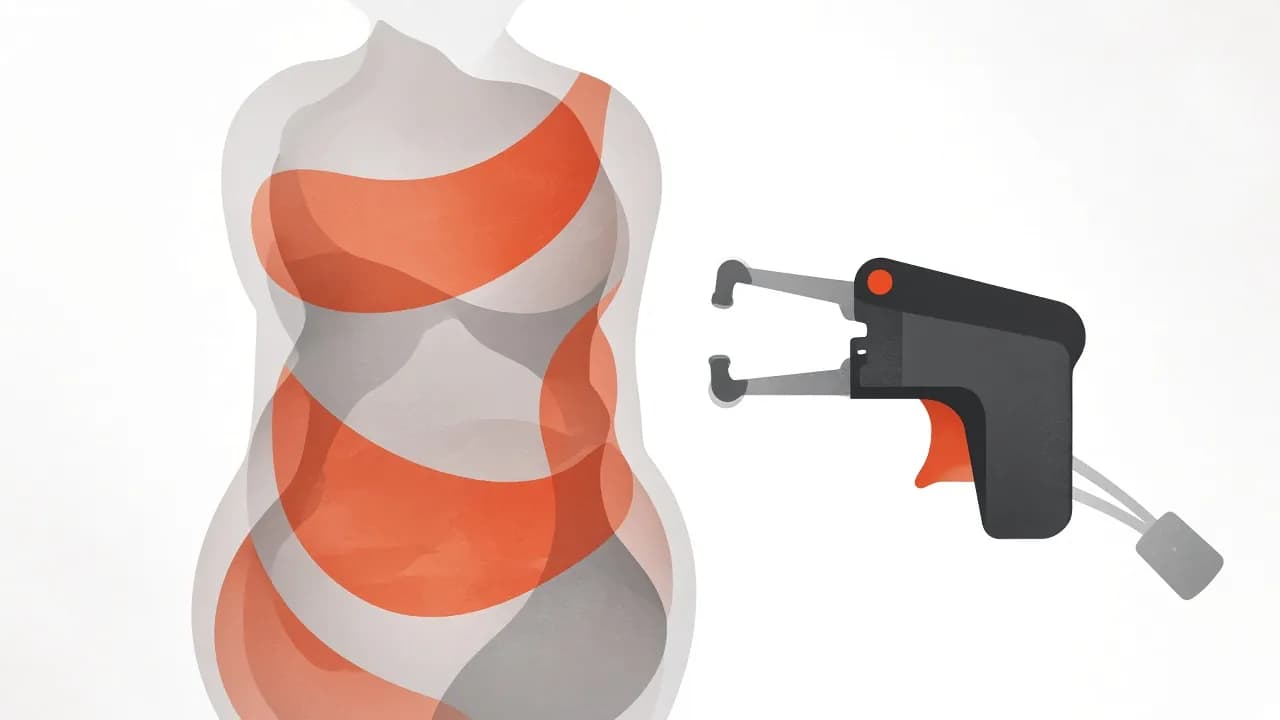
Body fat percentage: healthy ranges and how smart scales measure it
4 min read
Metrics explained
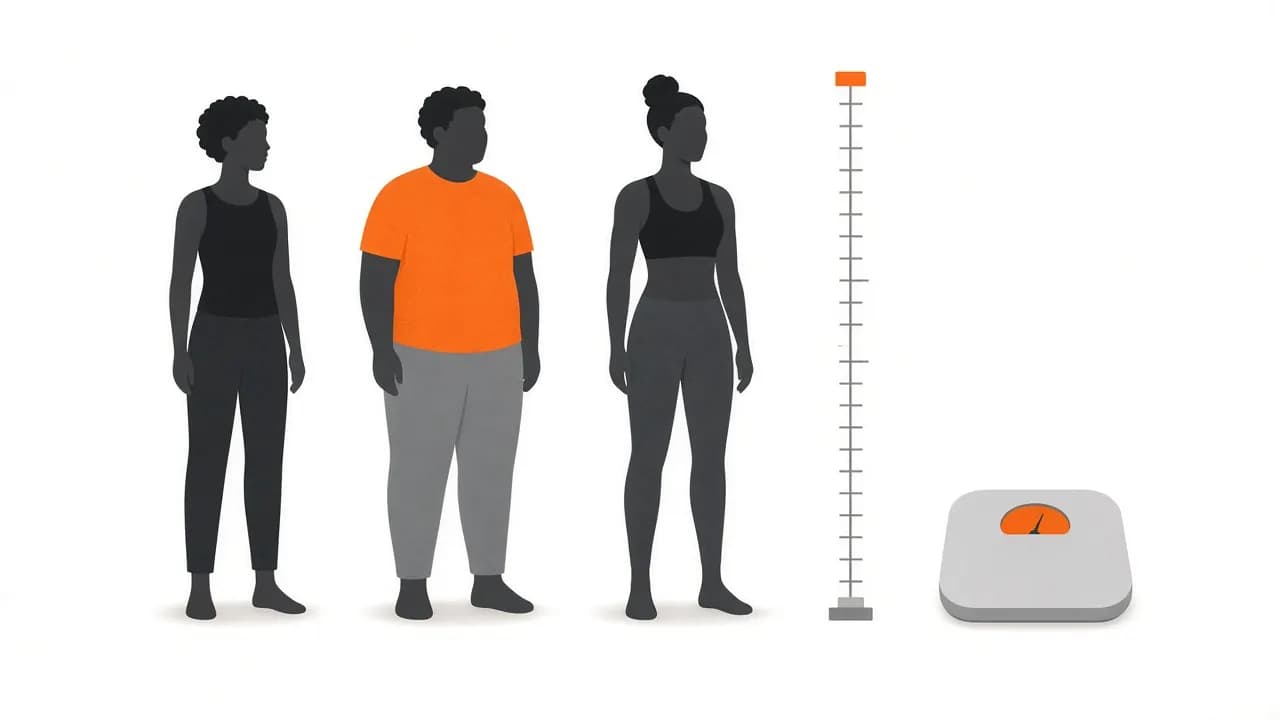
BMI: how it's calculated, what it means and where it fails
3 min read

Metrics explained
Muscle mass: what smart scales report and why it matters
3 min read
Metrics explained
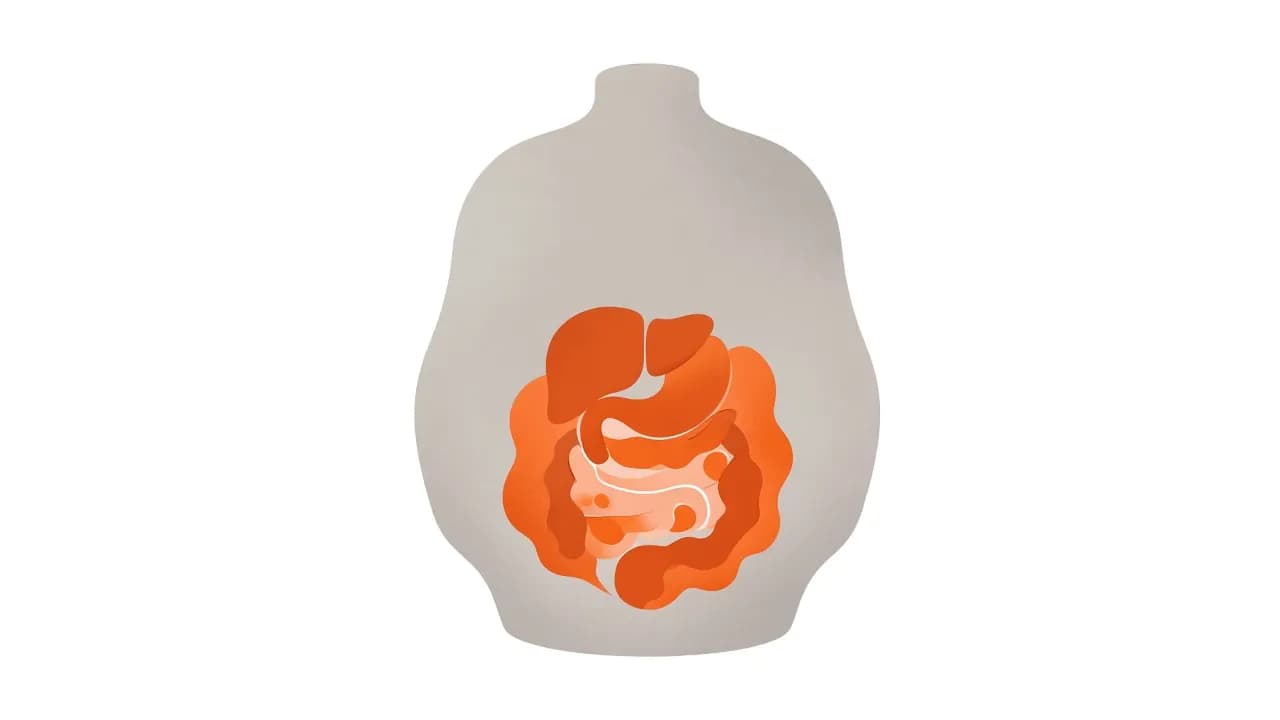
Visceral fat: the fat you can't see and why it matters most
3 min read
Metrics explained
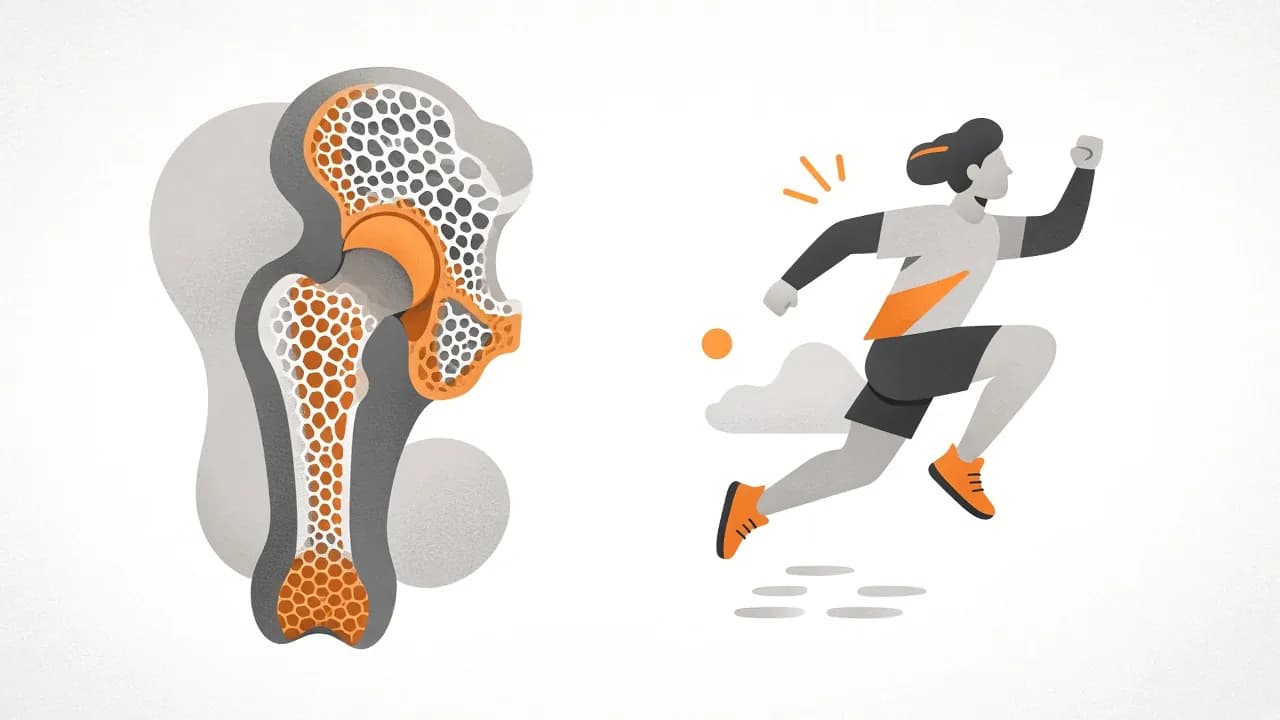
Bone mass on smart scales: what it means (and what it doesn't)
3 min read
Metrics explained
Body water and hydration: reading the numbers from your scale
3 min read
Metrics explained
Blood pressure: categories, home measurement and what moves it
4 min read
Metrics explained
Blood glucose and CGMs: reading your glucose curve
4 min read
Metrics explained
Glucose time in range (TIR): the CGM metric that matters most
3 min read
Metrics explained
FTP (functional threshold power): what it is and how to test it
4 min read
Metrics explained
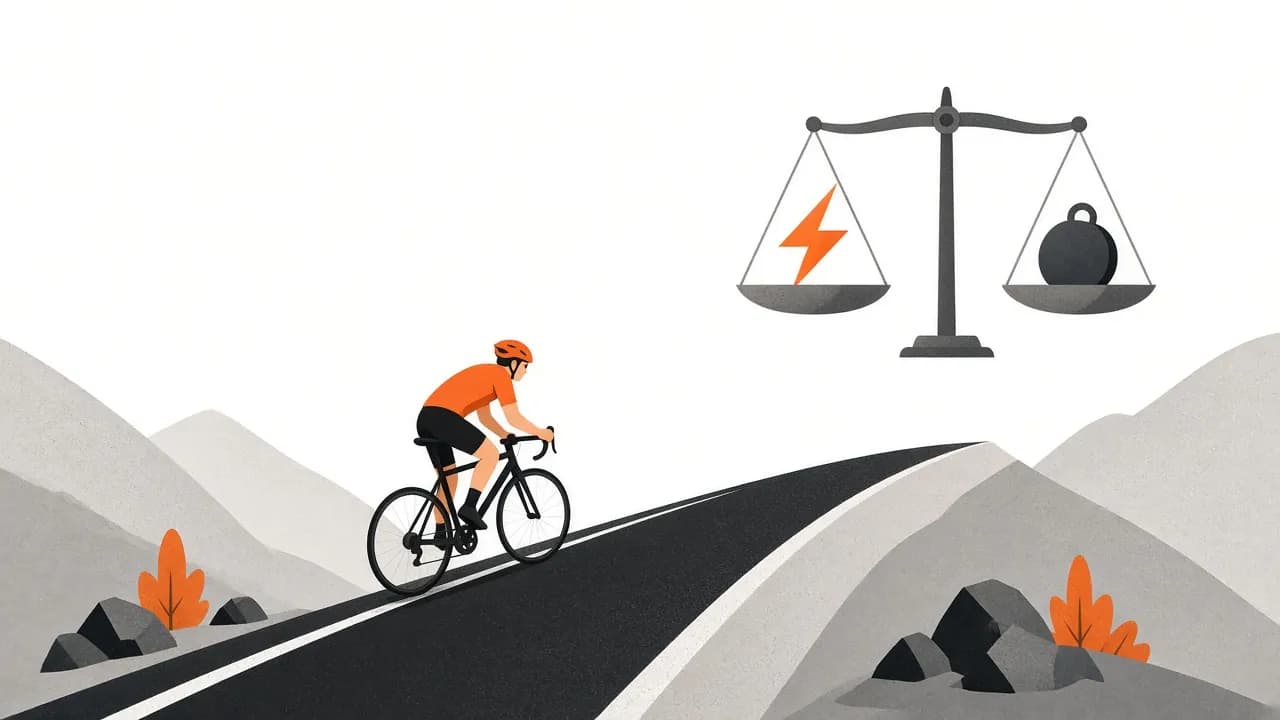
Power-to-weight ratio (W/kg): why it decides climbs and Zwift races
3 min read
Metrics explained
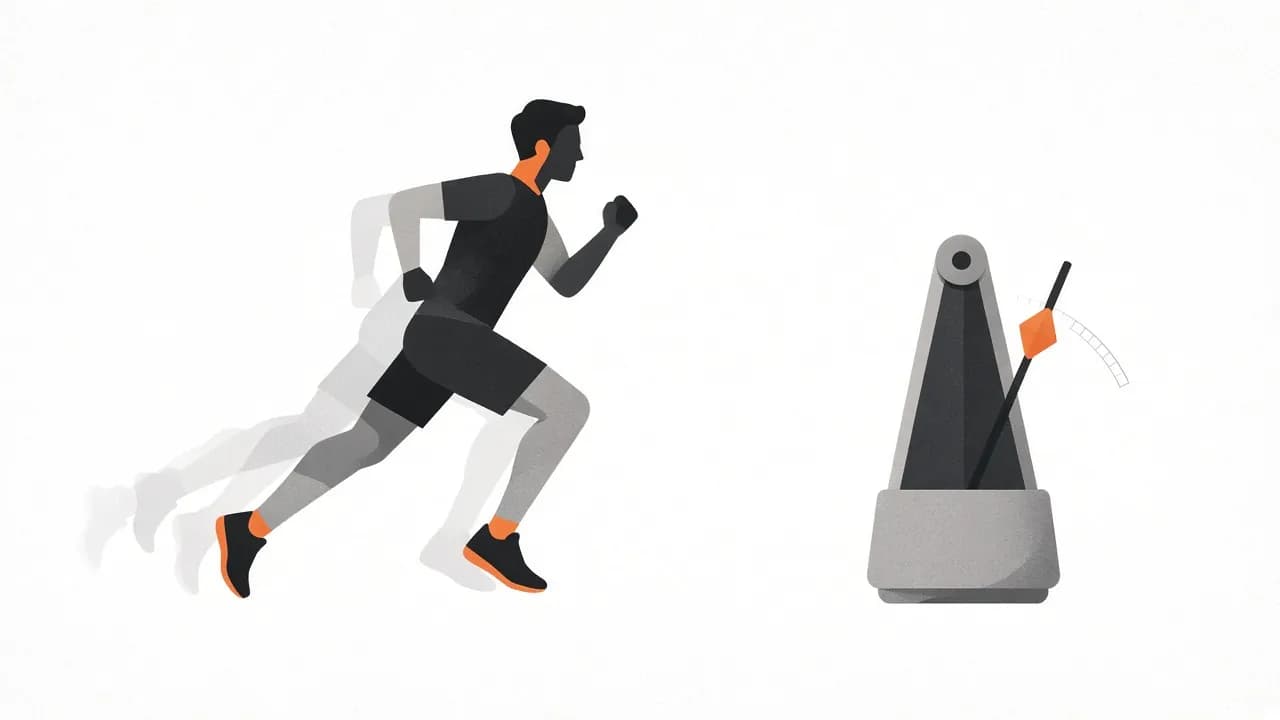
Cadence in running and cycling: is there an ideal number?
3 min read

Metrics explained
Lactate threshold: the most trainable marker of endurance
4 min read

Metrics explained
Training load explained: TRIMP, TSS, strain and relative effort
4 min read

Metrics explained
Fitness, fatigue and form (CTL, ATL, TSB): the performance management chart
3 min read
Metrics explained
WHOOP Strain: how the 0–21 scale works
3 min read
Metrics explained
WHOOP Recovery score: what drives it and how to act on it
3 min read
Metrics explained
Oura Readiness score: the contributors and how to use them
3 min read

Metrics explained
Which blood tests are worth doing — a practical panel for active adults
4 min read
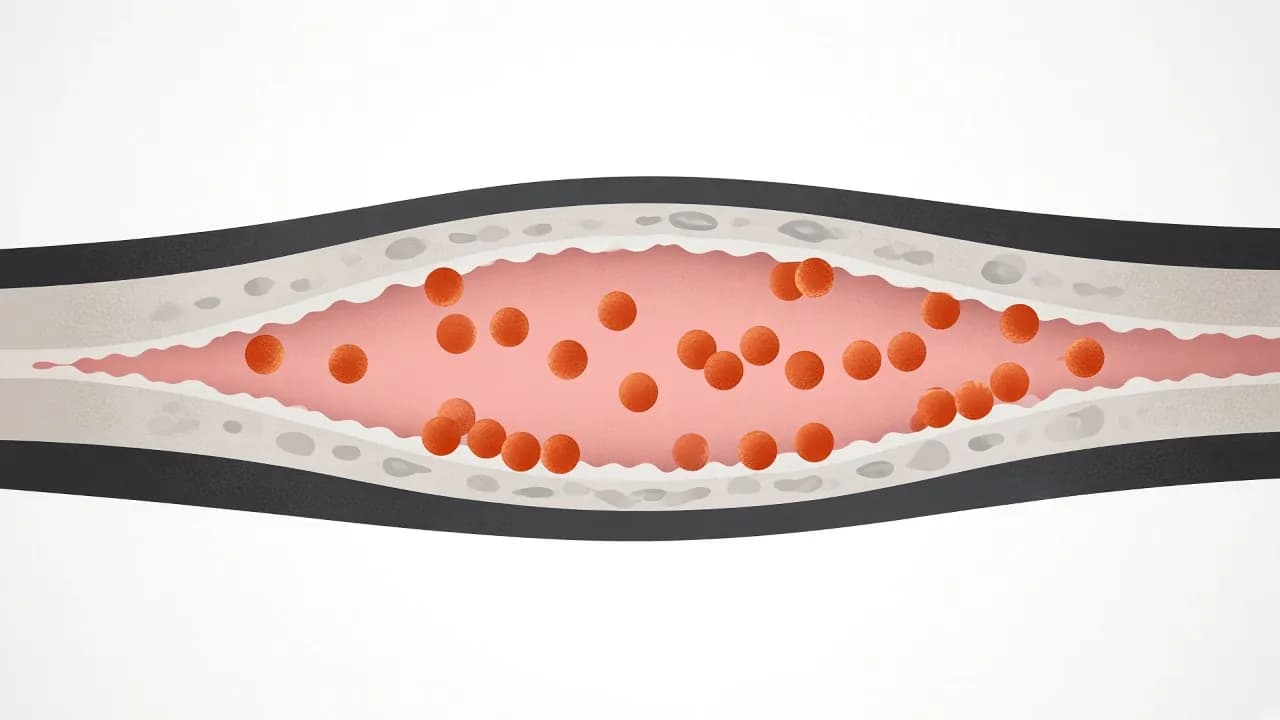
Metrics explained
ApoB and Lp(a): the two lipid tests that matter most
3 min read
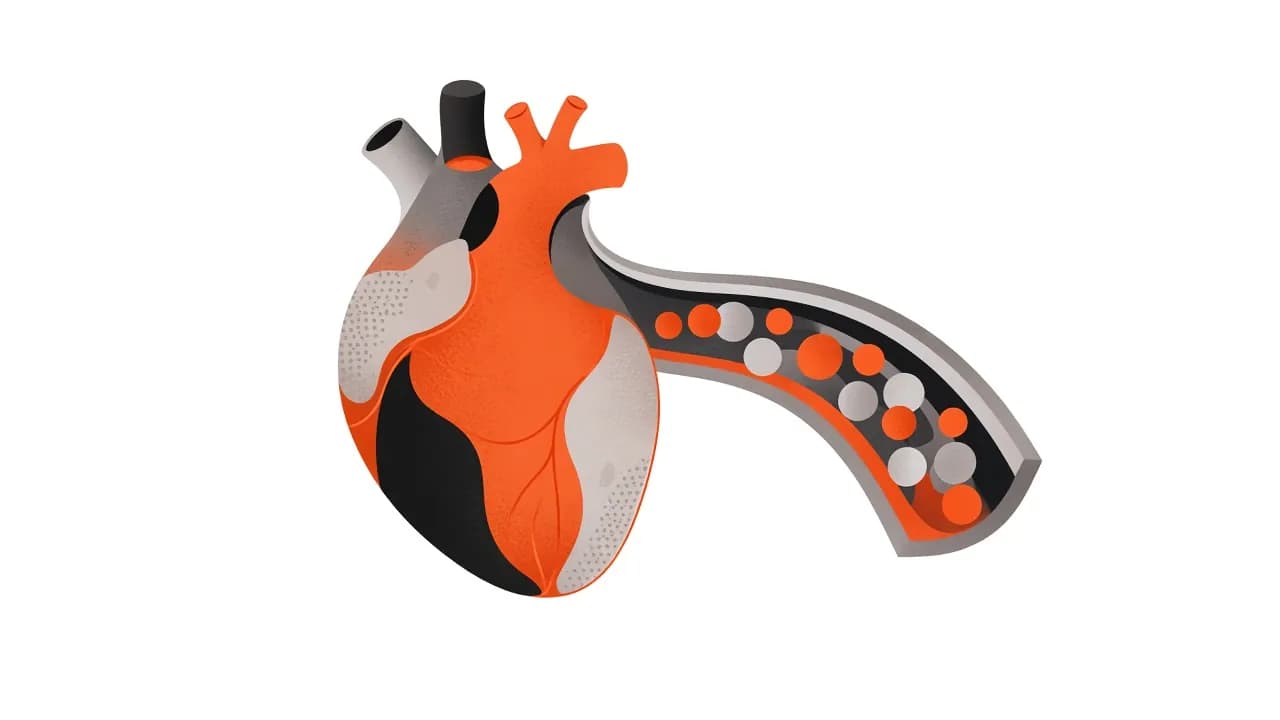
Metrics explained
The lipid panel: LDL, HDL, triglycerides and total cholesterol explained
3 min read
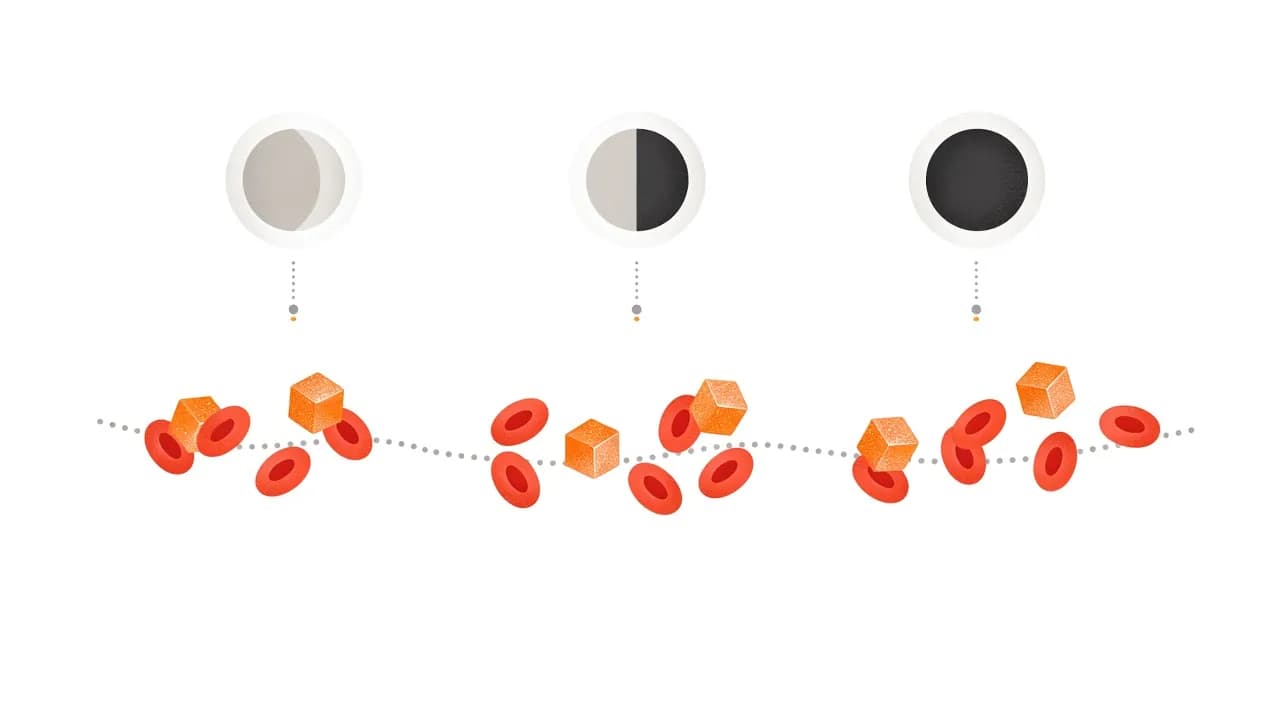
Metrics explained
HbA1c, fasting glucose and fasting insulin: reading your metabolic health
3 min read
Metrics explained
hs-CRP: measuring low-grade inflammation
3 min read
Metrics explained
Ferritin, iron and haemoglobin: the endurance athlete's blind spot
3 min read

Metrics explained
Stress scores on wearables: what they really measure
3 min read
Metrics explained
TSH and free T4: checking your thyroid
3 min read
Metrics explained
Testosterone: what the number means for training and recovery
3 min read
Metrics explained
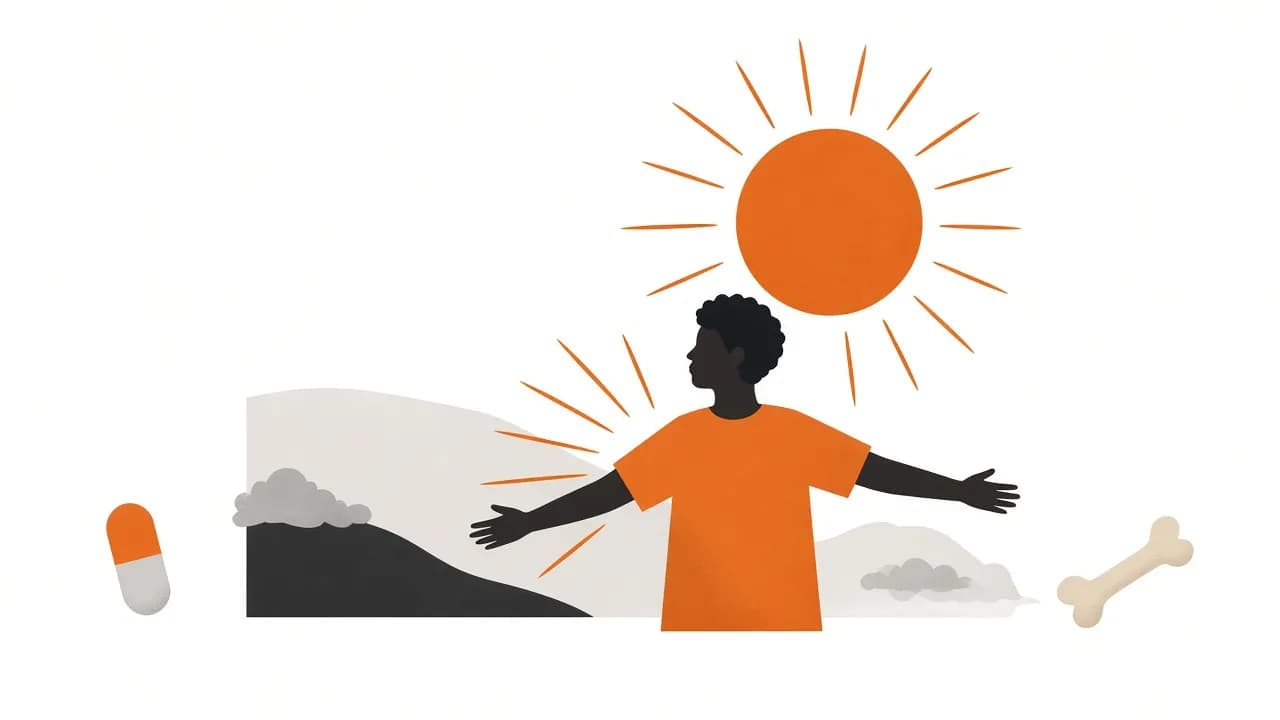
Vitamin D and B12: two common deficiencies worth testing
3 min read

Metrics explained
Garmin Body Battery: charging, draining and what it tells you
4 min read
Metrics explained
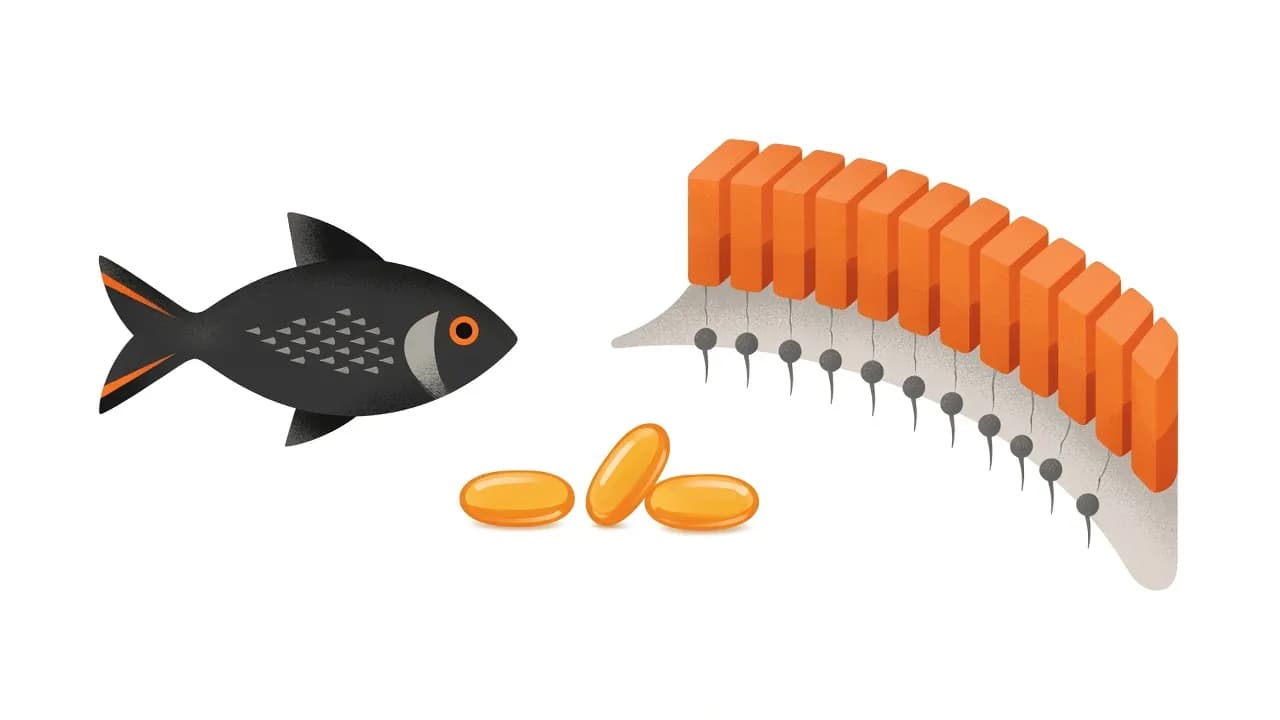
The omega-3 index: are you getting enough EPA and DHA?
3 min read
Metrics explained
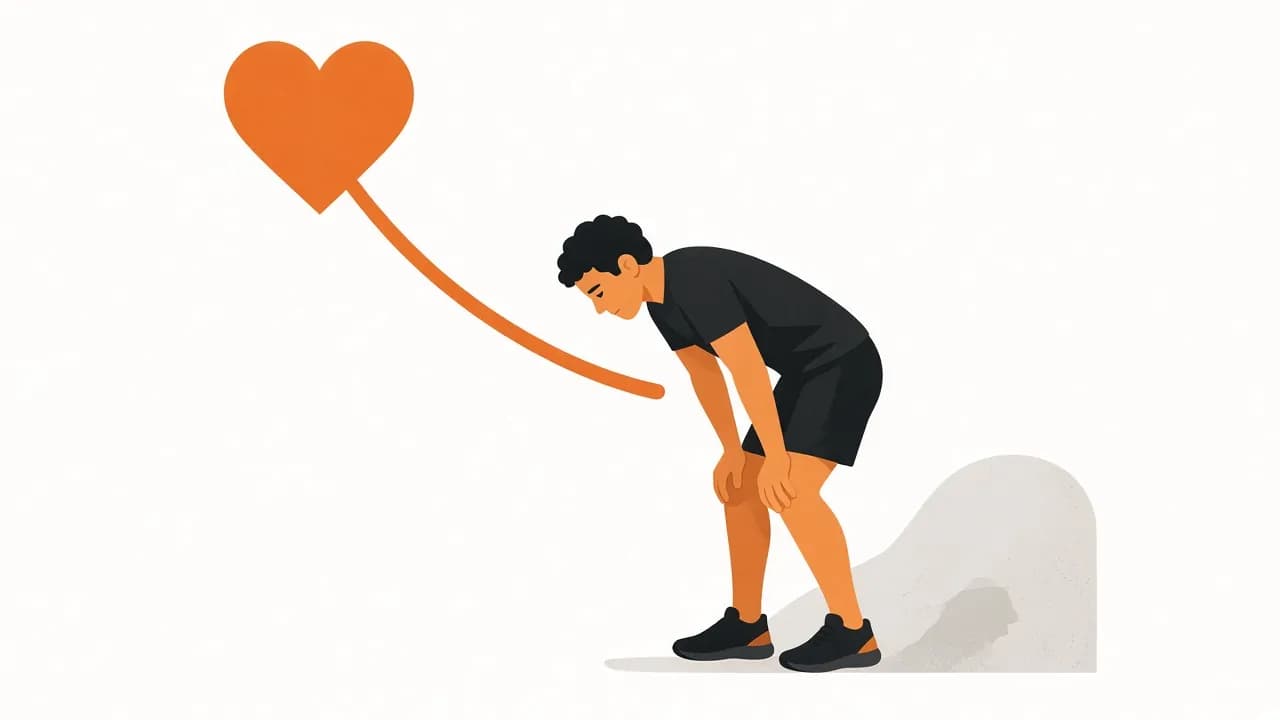
Heart rate recovery: how fast your heart rate drops after exercise
3 min read
Metrics explained
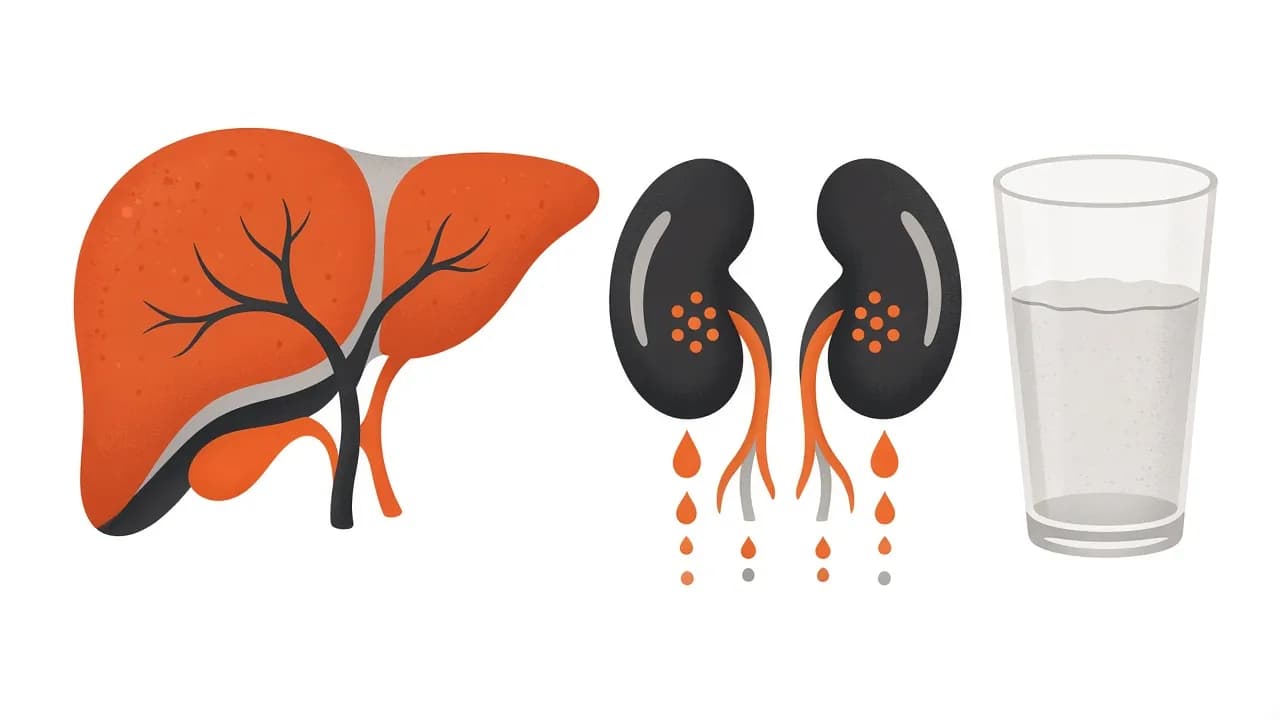
ALT, AST, creatinine and eGFR: liver and kidney markers for active people
3 min read
Metrics explained
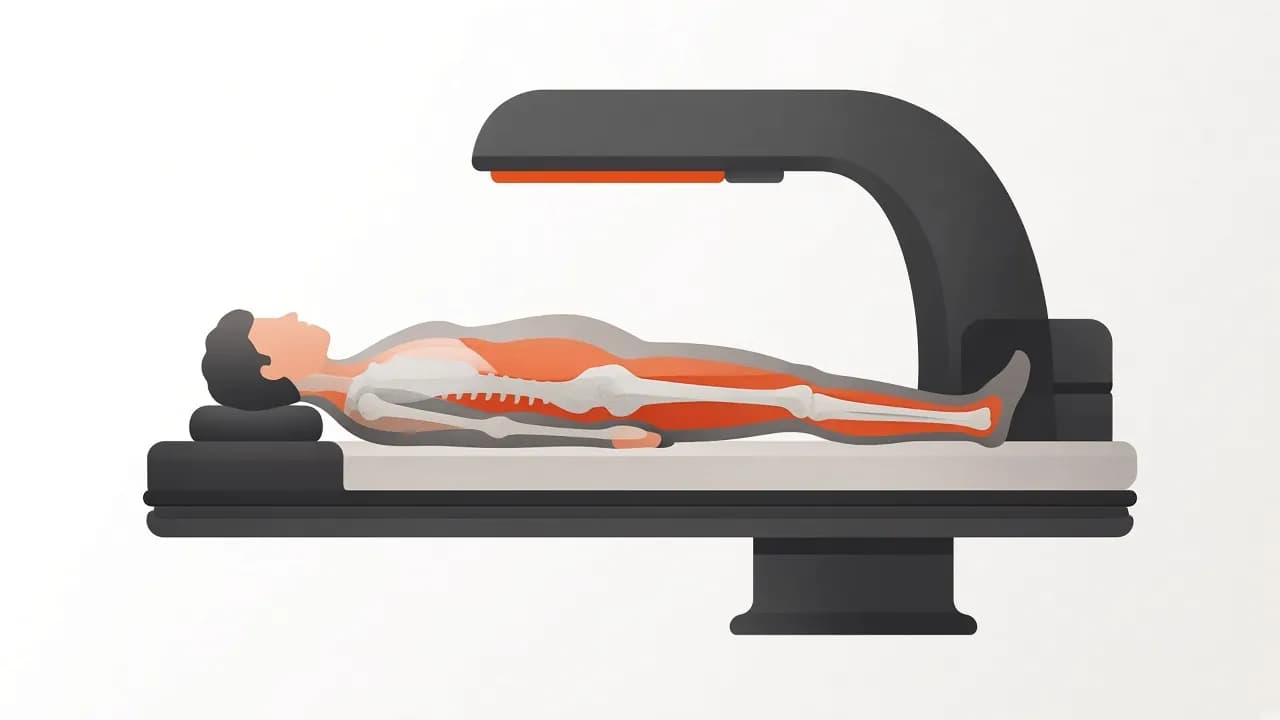
DEXA scans: the most accurate way to measure body fat — and calibrate your scale
3 min read

Metrics explained
Cardiac drift (decoupling): why heart rate rises at the same pace
3 min read
Metrics explained
Running pace: GPS accuracy, grade-adjusted pace and training paces
4 min read
Metrics explained
Running dynamics: ground contact time, vertical oscillation and stride length
4 min read
Metrics explained
The fat-burning heart rate zone: myth, maths and what actually burns fat
8 min read
Metrics explained
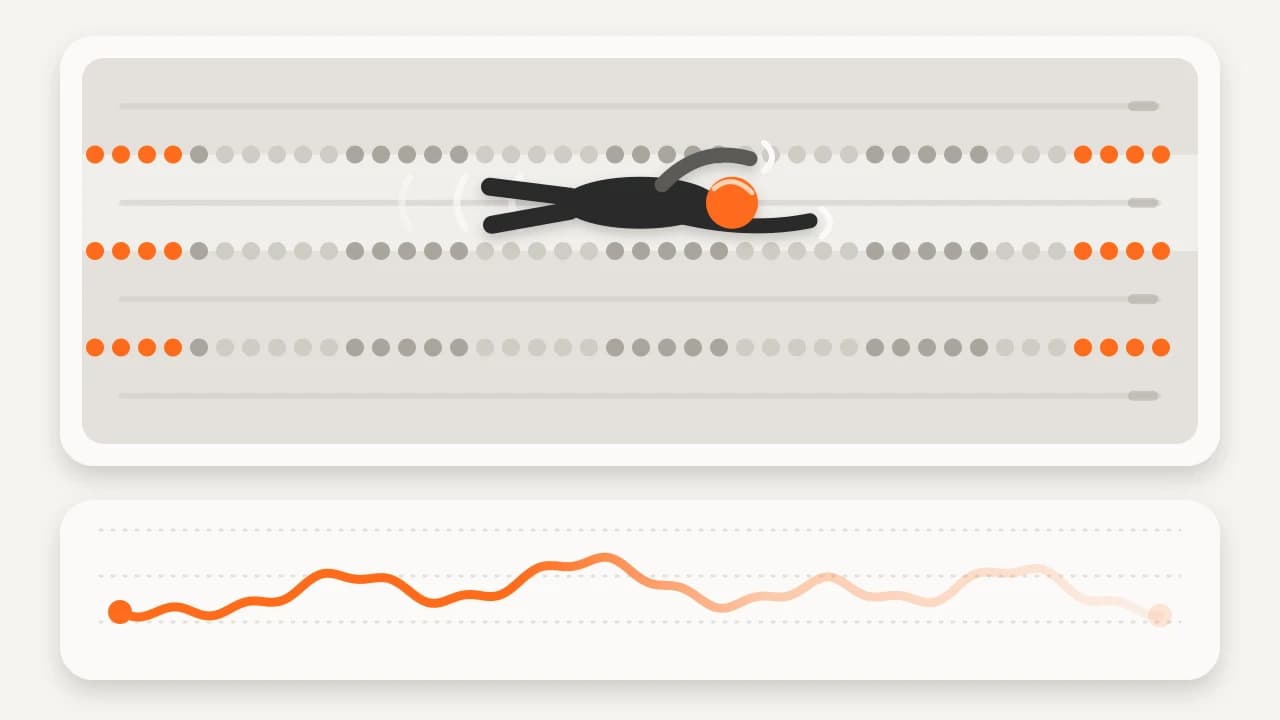
Heart rate in swimming: why it runs lower, zones in the pool and wrist-sensor accuracy
7 min read
Metrics explained
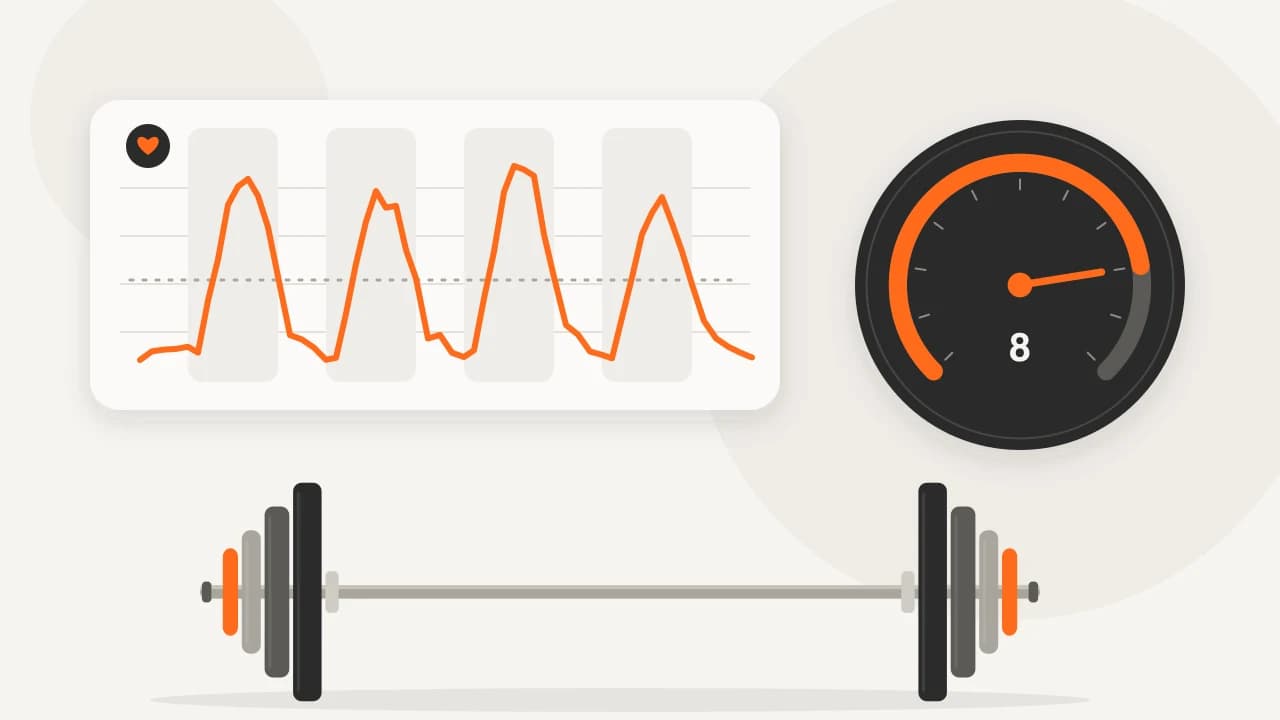
Strength training heart rate: what your wearable shows — and what it can’t
9 min read
Metrics explained
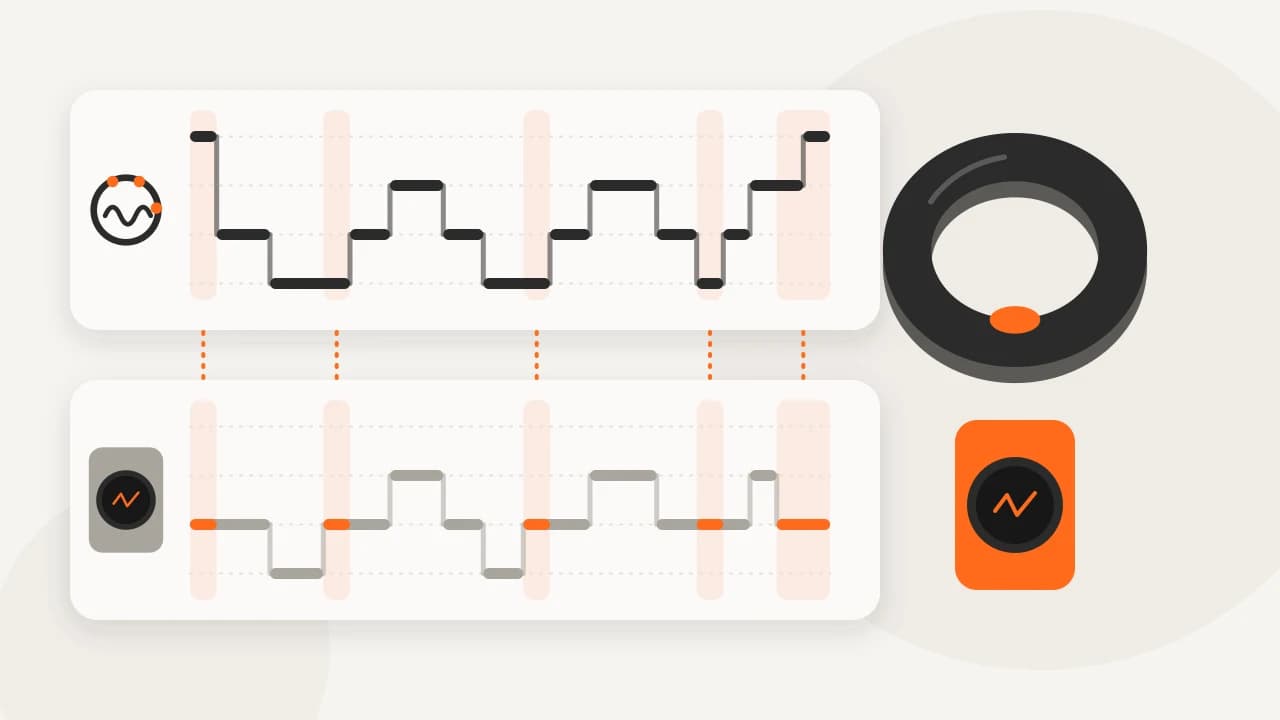
How accurate is sleep tracking? What wearables get right and wrong
9 min read
Metrics explained
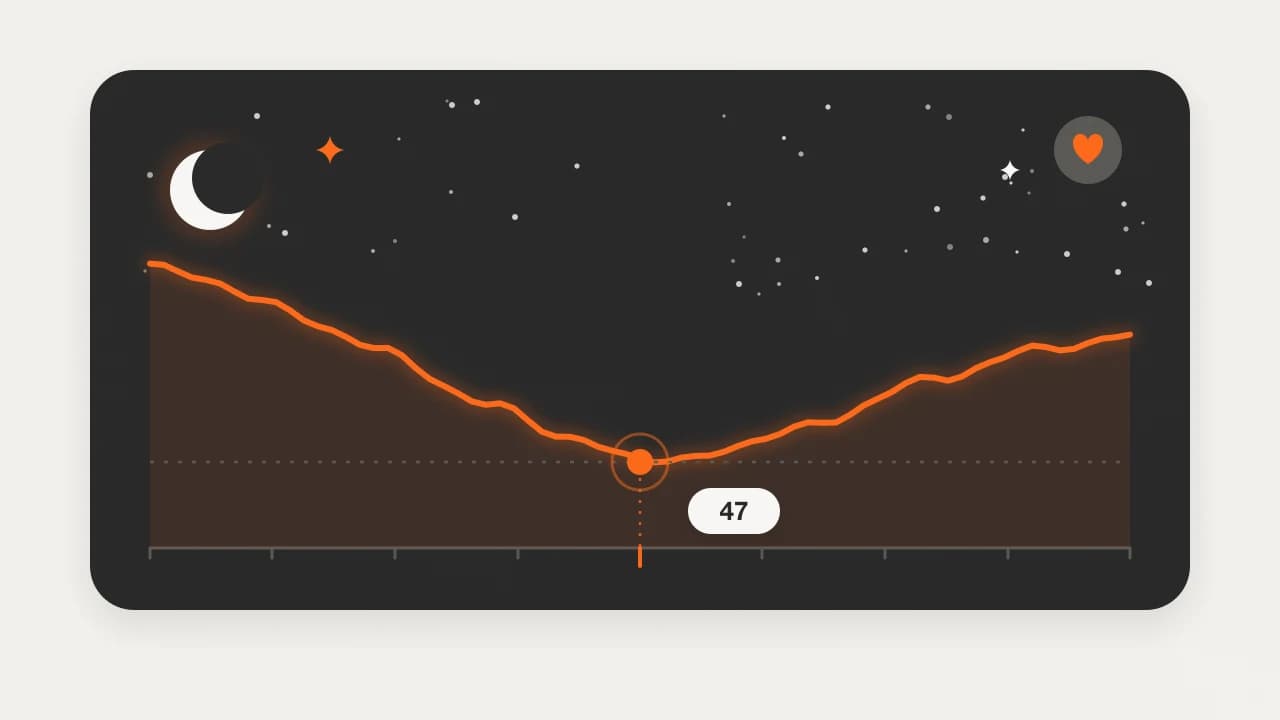
Sleeping heart rate: what’s normal, why it differs from resting heart rate and when it rises
7 min read
Metrics explained
Why is my heart rate so high when I exercise? Causes, normal ranges and when to worry
7 min read
Metrics explained
Cycling power zones explained: the 7 zones from FTP and how to train in them
7 min read
Metrics explained
Garmin Training Status and Training Readiness: what the labels mean and when to trust them
8 min read
Metrics explained
Apple Watch recovery and readiness: Vitals, Training Load, Sleep Score and the Readiness app
7 min read
Metrics explained
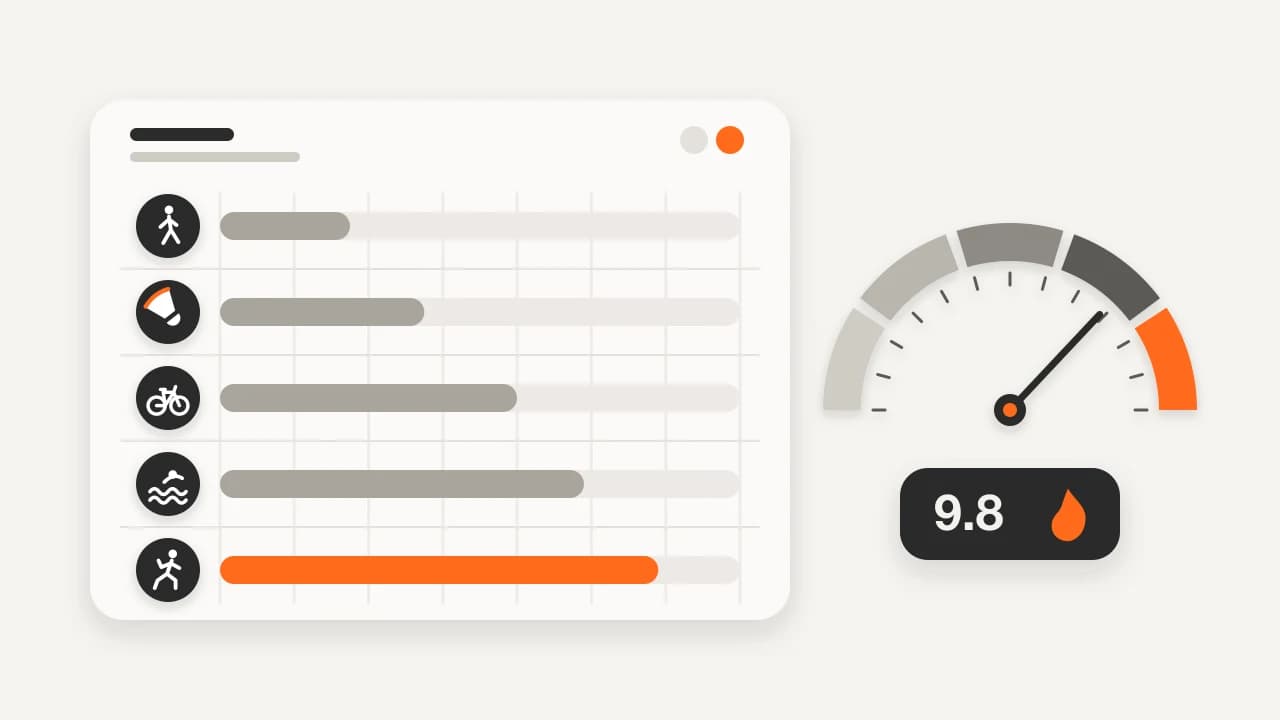
Calories burned by activity: MET values, per-hour tables and how wearables estimate them
10 min read
Metrics explained
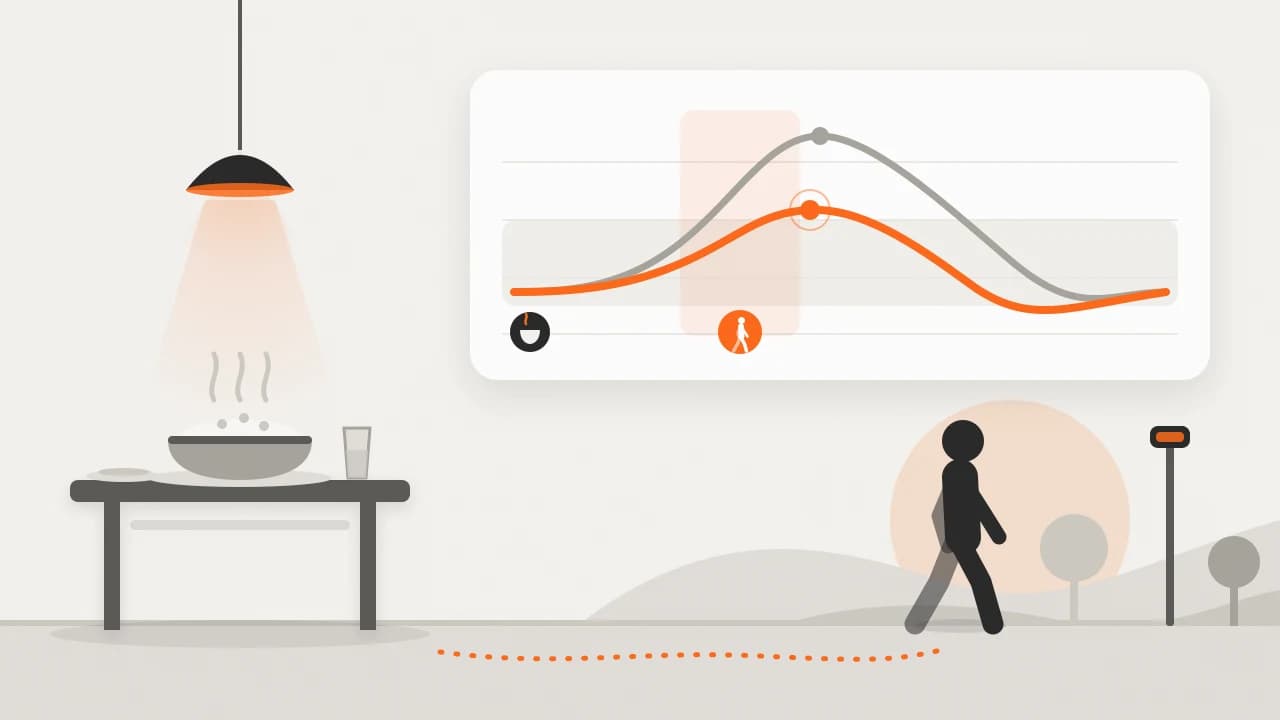
Walking after meals: what it does to blood sugar and how a CGM shows it
7 min read
Metrics explained
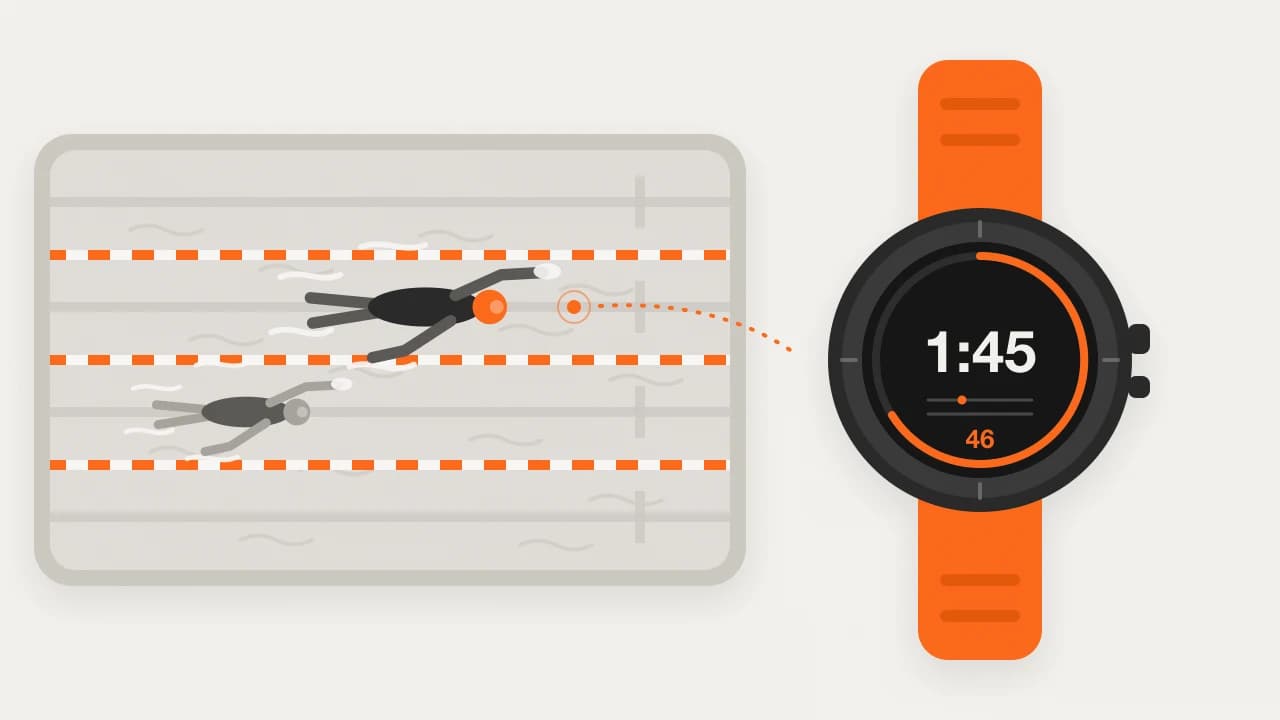
Swim pace per 100 m, CSS and SWOLF: reading your pool data
8 min read
Metrics explained
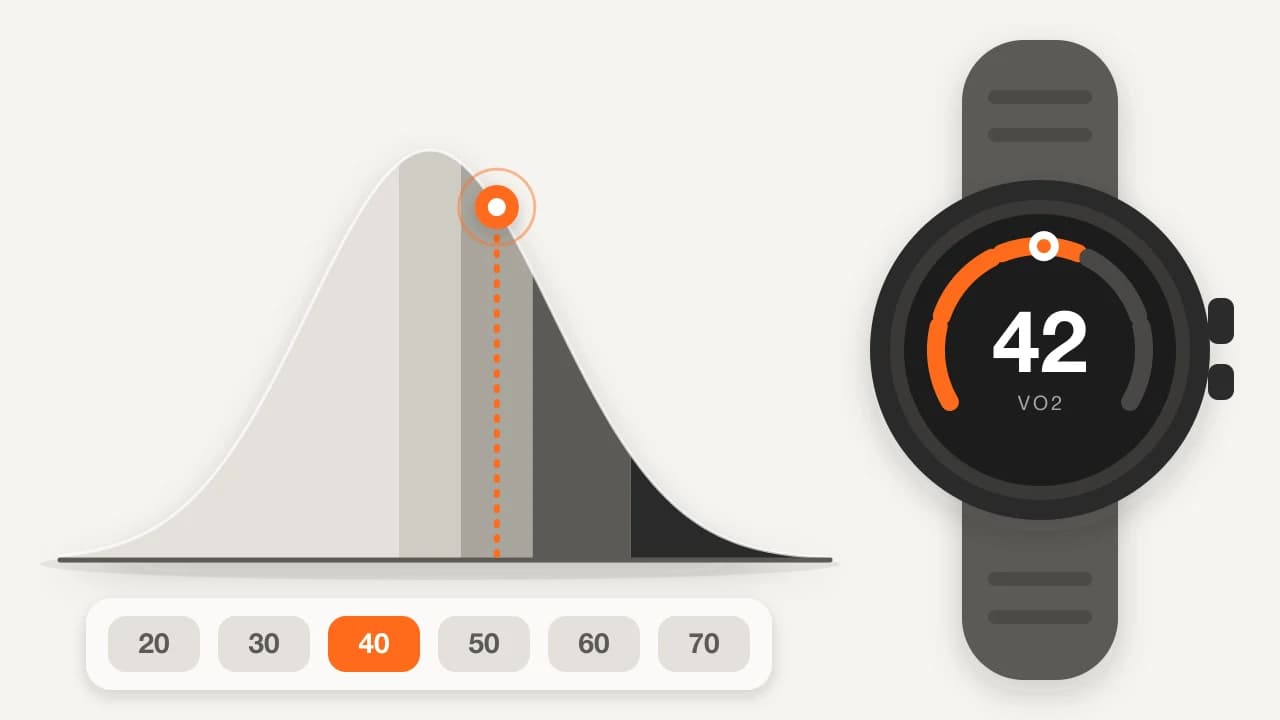
VO2 max by age and sex: norms, fitness age and what a good score looks like
8 min read
Metrics explained
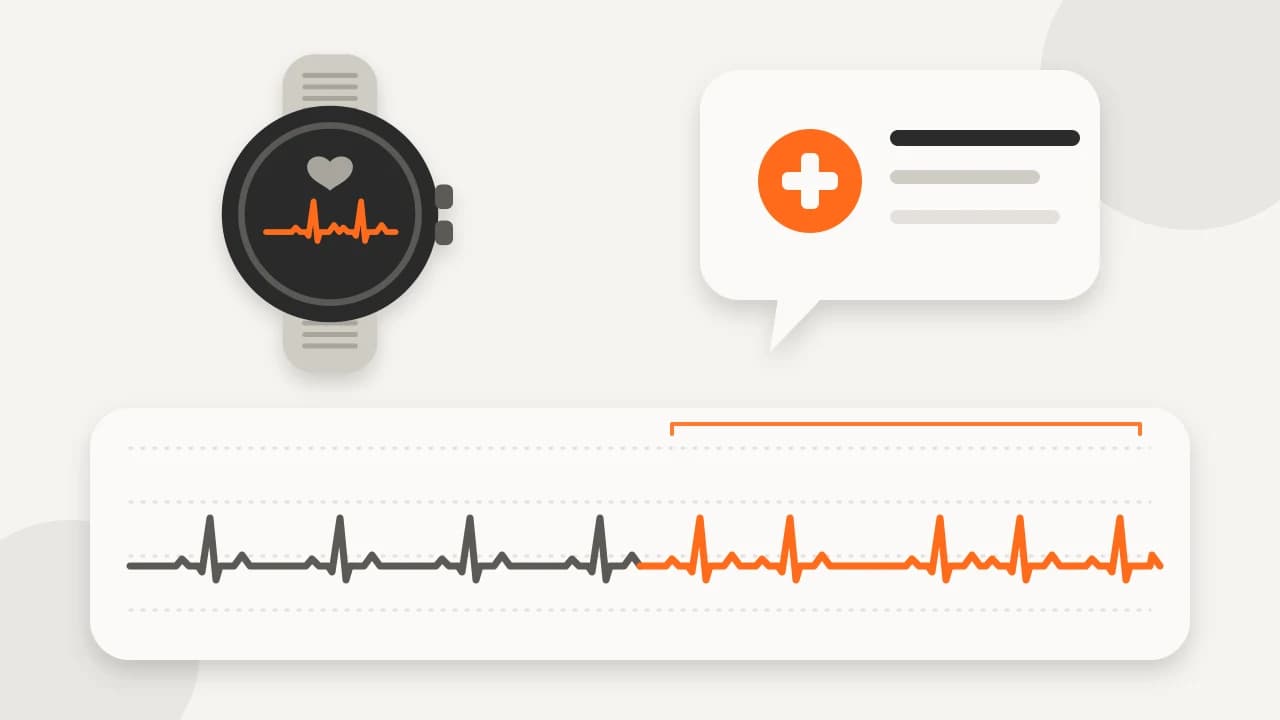
AFib and ECG on a smartwatch: what irregular-rhythm alerts can and can’t tell you
8 min read

Metrics explained
Sleep apnea detection on watches and rings: how breathing-disturbance alerts work
8 min read