

Metrics explained
Cycling power zones explained: the 7 zones from FTP and how to train in them
Cycling power zones split your riding into seven bands set as a percentage of FTP, from easy recovery to all-out sprints. Here is the full table, what each zone feels like and one session to train it.
Written by MoveVitals Editorial Collective
Community-authored educational content. Individual clinical review is identified only when a named review is actually recorded.
Editorial standards & corrections
Key takeaways
- FTP is the power you could hold for roughly an hour, and each zone is a percentage of it: endurance at 56–75 %, tempo at 76–90 %, threshold at 91–105 % and VO2 max at 106–120 %.
- Power reacts instantly and ignores heat, caffeine and fatigue, while heart rate lags by one to a few minutes and shows what the effort costs, so use power for targets and heart rate as a check.
- Endurance athletes often spend roughly 75–80 % of their time at low intensity, with one or two focused sessions a week in zones 4–5 or at sweet spot.
- Retest FTP every 6–8 weeks, because a stale FTP makes zones too easy after a good block and too hard after a break.
How power zones work
Cycling power zones are bands of effort set as a percentage of your FTP, the power you could hold for roughly an hour. The best-known version is the seven-zone model popularised by Dr Andrew Coggan and Hunter Allen. Every zone is anchored to FTP, so the whole table moves when your FTP changes; the FTP guide covers testing, and this page covers what to do with the number. Zone 7 has no real ceiling: it is maximal sprinting. Apps draw a few boundaries a point or two differently, and some use five or six zones, so stick to one table.
The 7 zones at a glance
| Zone | % FTP | Feels like | Hold time | Example session |
|---|---|---|---|---|
| Z1 Active recovery | below 55 % | Effortless spinning | No real limit | 30–60 min spin the day after hard work |
| Z2 Endurance | 56–75 % | Full sentences, steady breathing | Several hours | 2–4 h steady — see zone 2 training |
| Z3 Tempo | 76–90 % | "Comfortably hard", short sentences | 1–2 h, in blocks | 2 × 30 min |
| Z4 Threshold | 91–105 % | Hard but controlled, a few words | 20–60 min | 2 × 20 min at 95–100 % |
| Z5 VO2 max | 106–120 % | Very hard, no talking | 3–8 min | 5 × 4 min at 110–115 % |
| Z6 Anaerobic capacity | 121–150 % | Legs burning, near all-out | 30 s – 3 min | 8 × 1 min at 130–140 % |
| Z7 Neuromuscular | above 150 % | All-out sprint | Under 30 s | 6 × 10 s sprints |
Recover between efforts with easy riding about as long as each effort (3–5 minutes for sprints). Sweet spot, about 88–94 % of FTP, straddles zones 3 and 4. Hold times are typical for a rested rider, and zones 5–7 are only loosely tied to FTP because they depend more on VO2 max and anaerobic capacity than on threshold.
Cycling heart rate zones vs power zones
Both systems use the word "zone", but they measure different things.
| Power zones | Heart rate zones | |
|---|---|---|
| Measures | What you produce, in watts | What it costs your body, in bpm |
| Typical model | Seven zones from % FTP | Five zones from % of max heart rate, reserve or threshold |
| Response time | Instant | Lags by one to a few minutes |
| Affected by heat, caffeine, sleep, fatigue | No | Yes |
| Best for | Interval targets, climbs, comparing sessions | Easy days, long rides, spotting fatigue |
Zone numbers do not line up. "Zone 2" in heart rate terms (about 60–70 % of max heart rate in a common five-zone model) and in power terms (56–75 % of FTP) both mean easy endurance, but on a hot day or after a short night the same watts push your heart rate into zone 3. Under about three minutes heart rate cannot catch up, so power is the target.
Use them together: power sets the target, and heart rate and RPE show whether it costs more than usual. The same power at a lower heart rate over weeks suggests improving fitness; heart rate climbing at constant power is cardiac drift. See heart rate vs power vs pace and heart rate zones.
Training with the zones
- Build around zones 1–2. Endurance athletes often spend roughly 75–80 % of their time at low intensity — see polarized training.
- Add one or two focused sessions a week in zones 4–5 or at sweet spot, and extend the time in the zone before raising the target. Use zone 3 on purpose: it is useful but tiring, and easy to slide into on group rides.
- Retest and update. Retest FTP every 6–8 weeks. Indoor FTP is often 5–10 % lower than outdoors because of heat and a fixed position — see indoor cycling and ERG mode.
- Smooth the number. Judge intervals by their lap or 30-second average, not by every spike.
Common mistakes
- A stale FTP: zones come out too easy after a good block and too hard after a break.
- Chasing instant watts instead of the interval average.
- Treating zones 5–7 as exact: riders differ, with some strong sprinters and others steady "diesels".
- Mixing power sources: pedals, a trainer's meter and head units can differ by a few percent, so test and train on the same kit.
- Overriding the body: on a hot day or after a bad night, let heart rate and RPE veto the number.
In MoveVitals
Power data from Zwift, Wahoo, Garmin and Magene (via Strava) is stored with full streams alongside heart rate and cadence, and the original recording device is preserved, so a Zwift ride on a Magene T600 is labelled as such. You can compare power and heart rate on one timeline, and time in heart rate zone is calculated from the heart rate streams of every workout, with duplicates removed. You can store your FTP and maximum heart rate in your profile; keep the power-zone table from the app you train in, since each draws the boundaries slightly differently.
Worked example
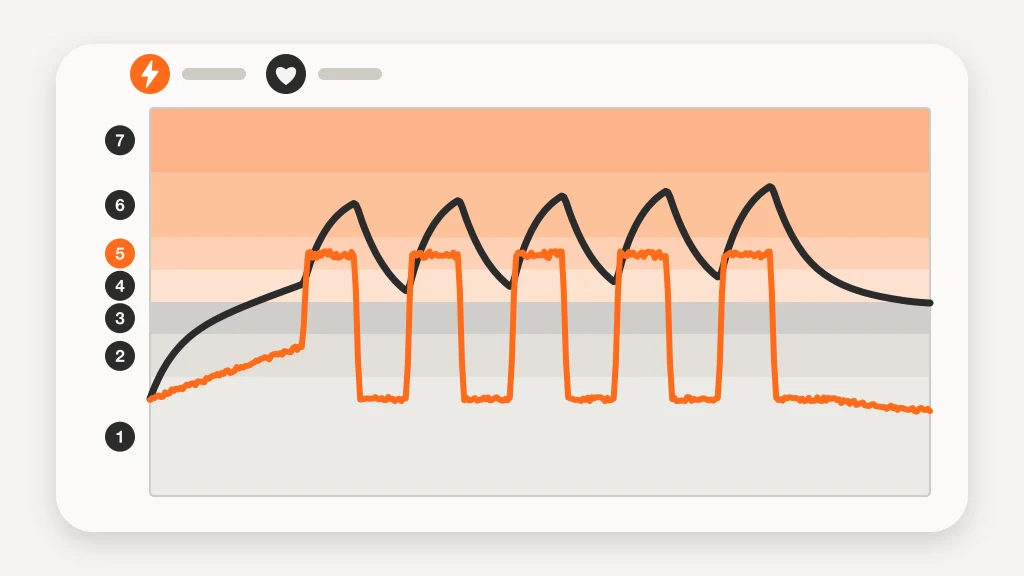
Illustrative scenario. Sam rides a 20-minute test at 263 W and sets FTP at 263 × 0.95 ≈ 250 W. His zones: Z1 below 138 W, Z2 140–188 W, Z3 190–225 W, Z4 228–263 W, Z5 265–300 W, Z6 303–375 W, Z7 above 375 W. On Thursday he rides 5 × 4 minutes at 110–115 % (275–288 W) with 4 minutes easy. Heart rate takes about two minutes to catch up with each effort, so he rides to the watts; by the fifth interval it reaches 176 bpm at the same power, a sign of accumulated fatigue rather than a reason to chase a number. On Sunday he rides 3 hours at 160–185 W (zone 2): heart rate rises from about 135 bpm in the first hour to 146 bpm in the third at the same watts, about 8 % — normal drift he tracks across weeks. The 95 % factor and zone limits are estimates; figures are illustrative.
Action steps
- Get a current FTP with a 20-minute or ramp test — see the FTP guide.
- Multiply it by each zone's percentages to get seven zones in watts and enter them in your head unit or app.
- Put most riding time in zones 1–2, with one or two sessions in zones 4–5 or at sweet spot.
- Set interval targets by power and use heart rate and RPE as a check, especially in heat.
- Retest every 6–8 weeks and update the zones.
Related guides
- FTP (functional threshold power): what it is and how to test it
- Heart rate vs power vs pace: which should you train with?
- Zone 2 training: the science and how to do it right
- Sweet spot and threshold training: raising your FTP
- Indoor cycling and ERG mode: getting the most from a smart trainer
- Power meters compared: pedals, crank, spider, hub and trainer — accuracy and what to buy
- Gravel cycling: training for long mixed-surface rides and races
FAQ
How do I calculate my power zones? Multiply your FTP by each zone's percentage range. With an FTP of 250 W, zone 2 (56–75 %) is 140–188 W and zone 4 (91–105 %) is 228–263 W. Recalculate whenever your FTP changes.
Are heart rate zones or power zones better for cycling? Neither is better alone. Power is precise and instant; heart rate shows the cost to your body. Use power for targets and heart rate to spot heat, fatigue or illness.
Why does zone 7 have no percentage? Sprint power depends on neuromuscular capacity, not threshold, so it is not usefully tied to FTP. It is simply maximal effort for a few seconds.
Can I train by power without a power meter? A smart trainer measures power too. Without either, heart rate and RPE still work; estimated power in some apps is only a rough guide.
References
- Allen and Coggan (2010). Training and Racing with a Power Meter (2nd ed.). VeloPress.
- Faude et al. (2009). Lactate Threshold Concepts. Sports Medicine. https://doi.org/10.2165/00007256-200939060-00003
- Seiler (2010). What is Best Practice for Training Intensity and Duration Distribution in Endurance Athletes?. International Journal of Sports Physiology and Performance. https://doi.org/10.1123/ijspp.5.3.276
- Stöggl et al. (2014). Polarized training has greater impact on key endurance variables than threshold, high intensity, or high volume training. Frontiers in Physiology. https://doi.org/10.3389/fphys.2014.00033
For general information only. This is not medical advice — talk to a qualified professional about your health.
Keep reading
Training science
Zone 2 training: the science and how to do it right
4 min read
Training science
Sweet spot and threshold training: raising your FTP
3 min read
Devices & setup
Strava and MoveVitals: workouts, streams and devices that arrive via Strava
3 min read
Training science
Interval training and HIIT: designing sessions that work
4 min read
Training science
Polarized training (80/20): easy most of the time, hard some of the time
4 min read
Mobility & stretching
Mobility vs flexibility: what's the difference and what do you need?
3 min read