

Metrics explained
The fat-burning heart rate zone: myth, maths and what actually burns fat
The fat-burning heart rate zone, usually quoted as 60–70 % of maximum heart rate, is real physiology but a weak shortcut to fat loss. Here is where it comes from, how to calculate it, and what matters more.
Written by MoveVitals Editorial Collective
Community-authored educational content. Individual clinical review is identified only when a named review is actually recorded.
Editorial standards & corrections
Key takeaways
- Fat supplies a larger share of energy at easy effort, but share is not total: hard work burns more energy per minute, and fat per minute is often similar or lower than in zone 2.
- For a 40-year-old with a max heart rate of 180 bpm, zone 2 is 108–126 bpm by percent of max and 132–144 bpm by percent of reserve, an 18 bpm gap between methods.
- The American College of Sports Medicine found that 150–250 minutes a week of moderate activity alone gives only modest weight loss.
- A meta-analysis of 13 trials in overweight adults found that high-intensity intervals and moderate continuous training both reduced fat mass, so intensity is a choice.
- In a study of seven wrist devices, none estimated energy expenditure with less than 20 % error, so "fat burn" labels are not measurements.
Where the "fat-burning zone" comes from
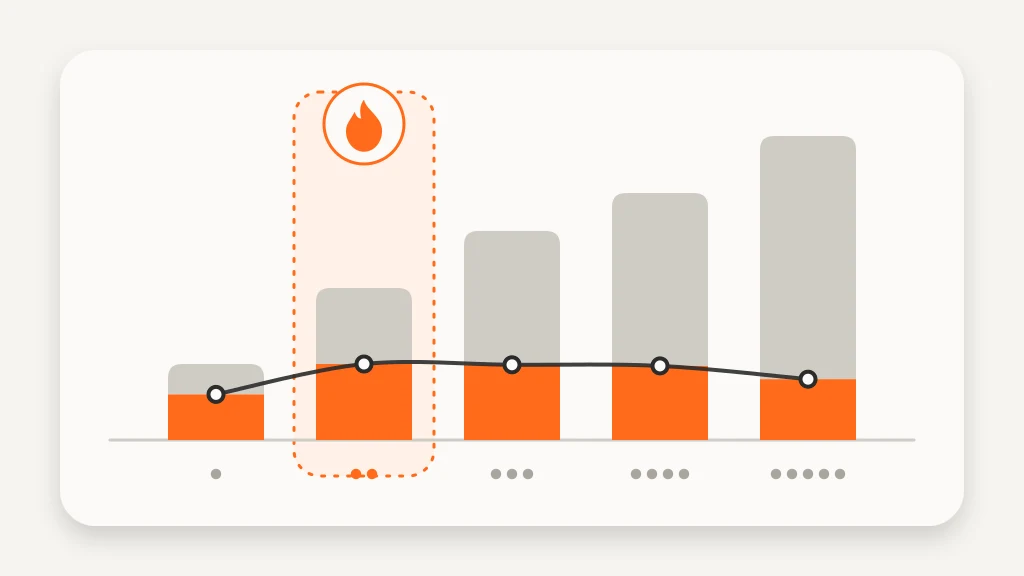
Your body always burns a mix of fat and carbohydrate: fat supplies the larger share at rest and easy effort, and carbohydrate takes over as intensity rises. The rate of fat oxidation, however, climbs from low to moderate intensity, peaks (a point called Fatmax) and then falls. In 300 healthy adults on a treadmill the peak came on average at about 48 % of VO2 max, roughly 61 % of maximum heart rate, with large differences between people. In trained people it sits higher, around 59–64 % of VO2 max. That physiology is behind the familiar gym chart: 60–70 % of maximum heart rate is near the peak for many people. The chart turned an average into a rule. So is the fat burning zone a myth? Partly: the physiology is real, the shortcut is not.
Share is not the same as total
| Intensity | Share of energy from fat | Energy per minute | Fat per minute |
|---|---|---|---|
| Easy (zone 1) | Highest | Low | Moderate |
| Moderate (zone 2) | High | Medium | Near its peak for many people |
| Hard (zones 4–5) | Low | High | Often similar or lower |
Round, illustrative numbers for a 70 kg person: jogging in zone 2 burns about 8 kcal per minute, roughly half from fat (about 4 kcal); a hard interval burns about 13 kcal per minute with perhaps 30 % from fat (also about 4 kcal). Fat per minute is similar, but the hard effort spends far more energy overall, so 45 minutes of easy jogging and 30 minutes of intervals can cost a similar number of calories (see calories burned). Fuel used during a session is also not fat lost over weeks: carbohydrate burned in hard work is replaced by food, and the body adjusts its fuel mix from day to day, so body fat follows cumulative energy balance far more closely than the fuel mix of any one workout.
What the evidence says about fat loss
- Volume first. The American College of Sports Medicine position stand found that 150–250 minutes a week of moderate activity gives only modest weight loss on its own, while more than 250 minutes a week was associated with clinically significant loss, and results are better alongside moderate diet changes.
- Intensity is a choice. A meta-analysis of 13 trials in overweight adults found that high-intensity intervals and moderate continuous training reduced fat mass and waist circumference similarly, with intervals taking about 40 % less time.
- "Afterburn" is real but small. Oxygen use stays raised after hard sessions, yet the extra energy is minor next to the session itself, so "a high heart rate burns fat for hours" overstates it. Hard sessions still earn their place for time and fitness (see interval training and HIIT).
How to calculate your fat-burning zone
- Get a maximum heart rate. Best is a value from a recent all-out effort (see maximum heart rate); otherwise use 208 − 0.7 × age (Tanaka) as a placeholder, which usually beats 220 − age.
- Pick one method. Percent of max HR: max HR × percentage. Heart-rate reserve (Karvonen): resting HR + percentage × (max HR − resting HR).
- Check with the talk test: full sentences but slightly breathy is roughly zone 2.
Example for a 40-year-old with a max heart rate of 180 bpm and a resting heart rate of 60 bpm:
| Zone | Percent of max HR | Percent of reserve |
|---|---|---|
| Zone 1 | 50–60 % → 90–108 bpm | 50–60 % → 120–132 bpm |
| Zone 2 | 60–70 % → 108–126 bpm | 60–70 % → 132–144 bpm |
| Zone 3 | 70–80 % → 126–144 bpm | 70–80 % → 144–156 bpm |
| Zone 4 | 80–90 % → 144–162 bpm | 80–90 % → 156–168 bpm |
| Zone 5 | 90–100 % → 162–180 bpm | 90–100 % → 168–180 bpm |
The same "zone 2" label gives 108–126 bpm by one method and 132–144 bpm by the other, an 18 bpm gap, because the percentages mean different things. That is why a watch, a treadmill and a website can disagree (see heart rate zones). Any fat-burning heart rate calculator is doing one of these two sums. The fat-burning zone by age, as 60–70 % of a Tanaka maximum:
| Age | Estimated max HR | 60–70 % range |
|---|---|---|
| 20 | 194 bpm | 116–136 bpm |
| 30 | 187 bpm | 112–131 bpm |
| 40 | 180 bpm | 108–126 bpm |
| 50 | 173 bpm | 104–121 bpm |
| 60 | 166 bpm | 100–116 bpm |
| 70 | 159 bpm | 95–111 bpm |
Treat these as ±10 bpm. If you take medication that lowers heart rate, such as beta blockers, or have a heart condition, heart-rate targets may not apply: follow your clinician's advice and use perceived effort instead.
Common mistakes
- Reading "fat burn" as a measurement. In a study of seven wrist devices, heart rate was measured reasonably well but none estimated energy expenditure with less than 20 % error.
- Slowing to a stroll to "stay in the zone" and stopping early. Weekly volume matters more than the label.
- Using 220 − age unchecked. A zone built on the wrong maximum is wrong at every level.
- Skipping strength training, which helps keep muscle while you lose fat.
In MoveVitals
Time in zone is calculated from the heart-rate stream of each workout from Garmin, Polar, COROS, Suunto, WHOOP, Wahoo or Strava (Zwift rides and Apple Watch workouts arrive via Strava), with duplicates removed when two devices recorded the same session. MoveVitals does not measure fat burned; energy values stay with their source and the daily total follows your source priority. To judge whether training works, follow outcomes: weekly-average weight, waist and body fat from a smart scale (Withings or Garmin), body fat trend, and pace at a fixed heart rate. Wrist heart rate has limits too; see wrist heart rate accuracy.
Worked example
Illustrative scenario. Nadia, 40, wants to lose body fat. Her watch labels 108–126 bpm "fat burn" (60–70 % of an estimated maximum of 180 bpm), but with a resting heart rate of 60 bpm the reserve method puts zone 2 at 132–144 bpm. The talk test holds up to about 135 bpm, so she goes by that. Her week: three 45-minute zone 2 sessions (about 8 kcal per minute, roughly 360 kcal each), one 30-minute interval session (about 330 kcal), two strength sessions and daily walks. After 12 weeks her weekly-average weight is down from 74.0 to 72.1 kg, her waist is 3 cm smaller and her pace at 130 bpm has improved from 7:20 to 6:50 per km. The watch's "fat burn" minutes decided none of it: weekly volume, consistency and energy balance did. Figures are illustrative.
Action steps
- Find your maximum heart rate from a recent all-out effort, or use 208 − 0.7 × age as a placeholder.
- Pick one method (percent of max HR or of reserve) and confirm zone 2 with the talk test.
- Build toward 150–250 minutes of activity a week or more, mostly easy, with one optional interval session and two strength sessions.
- Track weekly-average weight, waist, resting heart rate and pace at a fixed heart rate rather than "fat burn" minutes.
Related guides
- Heart rate zones explained: how to set and use them
- Zone 2 training: the science and how to do it right
- Maximum heart rate: formulas, field tests and why age-based estimates fail
- Calories burned: active, resting and total energy expenditure
- Polarized training (80/20): easy most of the time, hard some of the time
- Running for weight loss: how often, how fast and what your watch can (and can't) tell you
- Calories burned by activity: MET values, per-hour tables and how wearables estimate them
FAQ
Is there one heart rate that burns the most fat? Not exactly. On average fat oxidation peaks at moderate intensity (about 48 % of VO2 max, roughly 61 % of max heart rate, in a large general sample), but individual peaks vary widely and do not decide how much body fat you lose.
What is the fat-burning zone by age? About 60–70 % of your maximum heart rate (208 − 0.7 × age as a placeholder): 108–126 bpm at 40, for example. Treat it as ±10 bpm.
Is the fat-burning zone the same as zone 2? Close, not identical. Zone 2 fat oxidation is real, and in Polar's five-zone model zone 2 is 60–70 % of maximum heart rate, the band most "fat burn" charts use, but trackers label it differently and research defines zone 2 by thresholds. See zone 2 training.
Do hard workouts burn more fat afterwards? A little more oxygen is used for a while, but the extra energy is small next to the workout itself. It is neither a reason to avoid intervals nor a reason to force them.
References
- Venables et al. (2005). Determinants of fat oxidation during exercise in healthy men and women: a cross-sectional study. Journal of Applied Physiology. https://doi.org/10.1152/japplphysiol.00662.2003
- Achten and Jeukendrup (2004). Optimizing fat oxidation through exercise and diet. Nutrition. https://doi.org/10.1016/j.nut.2004.04.005
- Donnelly et al. (2009). Appropriate Physical Activity Intervention Strategies for Weight Loss and Prevention of Weight Regain for Adults. Medicine & Science in Sports & Exercise. https://doi.org/10.1249/MSS.0b013e3181949333
- Wewege et al. (2017). The effects of high-intensity interval training vs. moderate-intensity continuous training on body composition in overweight and obese adults: a systematic review and meta-analysis. Obesity Reviews. https://doi.org/10.1111/obr.12532
- Tanaka et al. (2001). Age-predicted maximal heart rate revisited. Journal of the American College of Cardiology. https://doi.org/10.1016/S0735-1097(00)01054-8
- Shcherbina et al. (2017). Accuracy in Wrist-Worn, Sensor-Based Measurements of Heart Rate and Energy Expenditure in a Diverse Cohort. Journal of Personalized Medicine. https://doi.org/10.3390/jpm7020003
For general information only. This is not medical advice — talk to a qualified professional about your health.
Keep reading
Sports
Walking for fitness and weight loss: pace, heart rate zones and how much is enough
9 min read
Training science
Zone 2 training: the science and how to do it right
4 min read
Training science
Polarized training (80/20): easy most of the time, hard some of the time
4 min read
Sports
Japanese interval walking: the 3-minute fast / 3-minute slow method, step by step
8 min read
Training science
Interval training and HIIT: designing sessions that work
4 min read
Sports
Trail running with a watch: heart rate, climbs and pacing by effort
7 min read