

Metrics explained
Calories burned by activity: MET values, per-hour tables and how wearables estimate them
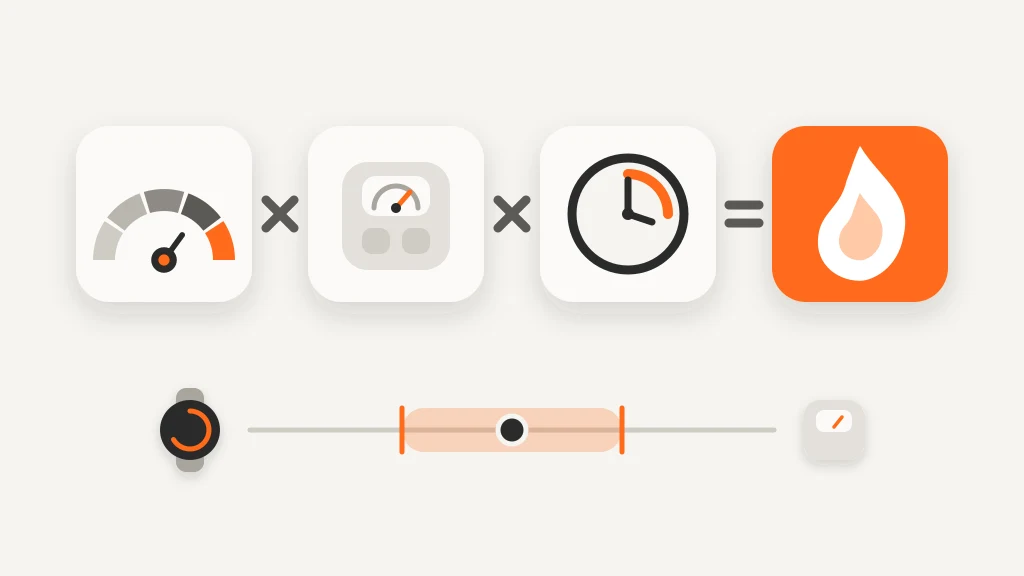
You can estimate calories burned by activity with one formula — MET × body weight (kg) × hours — and a table of MET values, which is the logic behind most apps and many watches. The result is a reasonable estimate rather than a measurement, so use it for planning and comparison.
Written by MoveVitals Editorial Collective
Community-authored educational content. Individual clinical review is identified only when a named review is actually recorded.
Editorial standards & corrections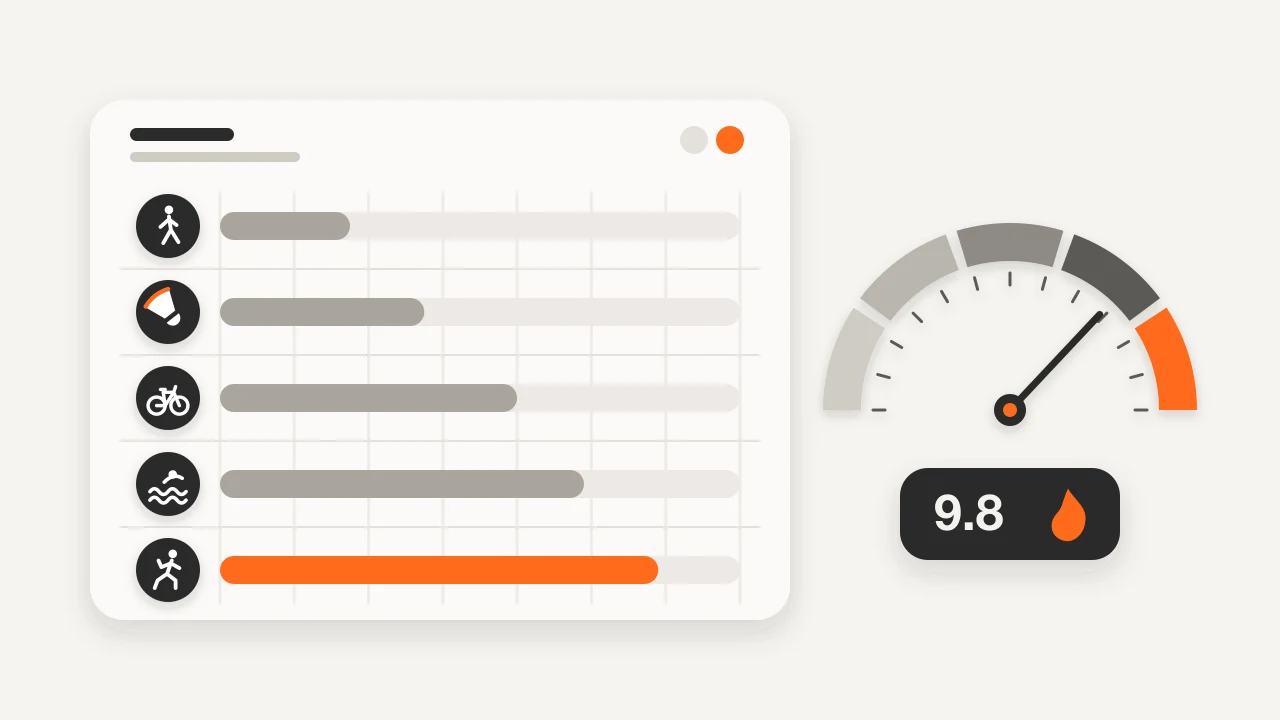
Key takeaways
- 1 MET is resting energy use, about 1 kcal per kg per hour, so a 70 kg person doing 30 minutes at 8 METs uses about 280 kcal.
- Per hour, running costs roughly 2.5–3 times as much as walking: walking at 4.8 km/h is 3.5 METs and running at 9.7 km/h is 9.8.
- Watch calorie errors of 10–30 % are common in steady walking and running and can reach 30 % or more in strength training, while a cycling power meter is the reliable exception.
- If your watch and a MET table differ by more than about 30 %, check the sport profile, sensor fit and heart-rate data first.
- Judge results by weekly average weight over 2–4 weeks, and do not eat back every calorie your watch reports.
The formula: MET × kg × hours
A MET (metabolic equivalent of task) compares the energy cost of an activity with rest. By convention, 1 MET is about 3.5 ml of oxygen per kg per minute, which works out to roughly 1 kcal per kg per hour. An activity rated at 8 METs therefore costs about eight times your resting rate.
Calories ≈ MET × weight (kg) × hours. A 70 kg person doing 30 minutes at 8 METs uses about 8 × 70 × 0.5 = 280 kcal. The values in the Compendium of Physical Activities, the standard reference (updated in 2011 and 2024), are gross: they include the resting energy you would have used anyway. The extra energy is (MET − 1) × kg × hours, here 245 kcal. They are averages for typical effort; your own cost varies with fitness, technique, terrain and conditions.
MET table by activity
Calories per hour for three body weights, rounded to the nearest 5. Scale up or down for shorter or longer sessions, and use the minutes you are actually active.
Walking, running, cycling and machines
| Activity | MET | 60 kg (kcal/h) | 75 kg (kcal/h) | 90 kg (kcal/h) |
|---|---|---|---|---|
| Walking, 4.8 km/h (3 mph) | 3.5 | 210 | 260 | 315 |
| Brisk walking, 6.4 km/h (4 mph) | 5.0 | 300 | 375 | 450 |
| Hiking, cross-country | 6.0 | 360 | 450 | 540 |
| Running, 8 km/h (5 mph, 7:30/km) | 8.3 | 500 | 620 | 745 |
| Running, 9.7 km/h (6 mph, 6:12/km) | 9.8 | 590 | 735 | 880 |
| Running, 11.3 km/h (7 mph, 5:19/km) | 11.0 | 660 | 825 | 990 |
| Cycling, easy (under 16 km/h) | 4.0 | 240 | 300 | 360 |
| Cycling, 19–22 km/h | 8.0 | 480 | 600 | 720 |
| Cycling, 22.5–25.5 km/h | 10.0 | 600 | 750 | 900 |
| Stationary bike, 100 W | 5.5 | 330 | 410 | 495 |
| Rowing machine, 100 W | 7.0 | 420 | 525 | 630 |
| Elliptical, moderate effort | 5.0 | 300 | 375 | 450 |
| Stair climber machine | 9.0 | 540 | 675 | 810 |
| Swimming, easy freestyle | 5.8 | 350 | 435 | 520 |
| Swimming, vigorous freestyle | 9.8 | 590 | 735 | 880 |
Sports and gym
| Activity | MET | 60 kg (kcal/h) | 75 kg (kcal/h) | 90 kg (kcal/h) |
|---|---|---|---|---|
| Badminton, social | 5.5 | 330 | 410 | 495 |
| Badminton, competitive | 7.0 | 420 | 525 | 630 |
| Tennis, doubles | 6.0 | 360 | 450 | 540 |
| Tennis, singles | 8.0 | 480 | 600 | 720 |
| Table tennis | 4.0 | 240 | 300 | 360 |
| Squash | 7.3 | 440 | 550 | 655 |
| Pickleball (estimate) | 4.5 | 270 | 340 | 405 |
| Basketball, game | 8.0 | 480 | 600 | 720 |
| Football (soccer), casual | 7.0 | 420 | 525 | 630 |
| Football (soccer), competitive match | 10.0 | 600 | 750 | 900 |
| Weight training, general | 3.5 | 210 | 260 | 315 |
| Circuit training, vigorous | 8.0 | 480 | 600 | 720 |
| Jump rope, moderate pace | 11.8 | 710 | 885 | 1,060 |
| Aerobic dance or dance fitness | 7.3 | 440 | 550 | 655 |
| Boxing, punching bag | 5.5 | 330 | 410 | 495 |
| Martial arts or kickboxing class | 10.3 | 620 | 770 | 925 |
| Yoga (hatha) | 2.5 | 150 | 190 | 225 |
| Pilates | 3.0 | 180 | 225 | 270 |
| Tai chi or qigong | 3.0 | 180 | 225 | 270 |
Outdoors, winter and water
| Activity | MET | 60 kg (kcal/h) | 75 kg (kcal/h) | 90 kg (kcal/h) |
|---|---|---|---|---|
| Golf, walking and carrying clubs | 4.3 | 260 | 320 | 385 |
| Climbing, low to moderate difficulty | 5.8 | 350 | 435 | 520 |
| Rucking or backpacking with a load | 7.0 | 420 | 525 | 630 |
| Downhill skiing or snowboarding, moderate | 5.3 | 320 | 400 | 475 |
| Cross-country skiing, moderate | 9.0 | 540 | 675 | 810 |
| Ice skating | 7.0 | 420 | 525 | 630 |
| Kayaking, moderate | 5.0 | 300 | 375 | 450 |
| Stand-up paddleboarding | 6.0 | 360 | 450 | 540 |
| Surfing | 3.0 | 180 | 225 | 270 |
Pickleball has no long-standing code, so its figure is an approximation from studies of recreational play. Values for jump rope and martial arts assume sustained effort that few people keep up for a full hour. For heart rate, recovery and training advice, each sport has its own page: badminton, tennis, pickleball, padel, table tennis, jump rope, climbing, boxing and kickboxing, yoga, Pilates, dance fitness, elliptical and stair climber, indoor rowing, swimming, strength training, HYROX, rucking, walking, skiing and snowboarding, skating, paddling, surfing, golf, basketball and football.
How wearables estimate calories
| Method | Typical use | Strength | Weak spot |
|---|---|---|---|
| MET × weight | Apps, gym machines, phone sport profiles | Simple and transparent | Same answer at every effort level; ignores how hard you really worked |
| Heart rate + profile (age, sex, weight, fitness) | Most sports watches and straps | Follows your actual effort in steady aerobic exercise | Poor for lifting and stop-start sports; stress, heat and caffeine inflate it; sensor errors carry through |
| Motion and speed (accelerometer, GPS) | Steps, walking and running | Good for steady walking and running on flat ground | Misses hills, wind, loads and non-running activity |
| Power (watts) | Cycling power meters | Measures mechanical work directly; for cycling, kcal ≈ kJ | Assumes a fixed efficiency of roughly 20–25 % |
How accurate are they?
The best-known validation study of wrist-worn devices found heart rate was measured fairly well but energy expenditure errors were large, averaging roughly 27–93 % across seven devices. Treat these as rules of thumb, not guarantees:
| Activity | Reliability of the watch estimate |
|---|---|
| Steady walking or running | Best case; often 10–30 % off |
| Cycling with a power meter | Good: kJ of work ≈ kcal burned |
| Cycling, heart rate only | Moderate |
| Swimming | Variable; depends on stroke detection |
| Strength training, circuits | Poor: heart rate does not track work; 30 % or more is possible |
| Stop-start sports (badminton, tennis, team sports) | Poor to moderate: heart-rate lag and rests between points |
| Yoga, Pilates, dance | Variable: low heart rate with real effort, and wrists that miss arm movement |
Why a table and your watch disagree
- Gross or net. Some apps show total calories, others only the part above rest. Compare like with like.
- Time. Tables assume continuous activity; real sessions include rests, waiting and warm-up.
- Body weight. Heavier bodies cost more to move. Keep your current weight in every app and device.
- Fitness and conditions. Efficient athletes burn a little less at the same speed; hills, wind, heat and load shift the number.
- Afterburn. For most sessions the extra energy after exercise is small; do not add it on top.
Using the numbers
Use a table to plan, your watch to compare this week with last week, and your weight trend over 2–4 weeks to check reality. Do not eat back every exercise calorie: an over-estimate can cancel your deficit. The idea that a low-intensity zone burns more fat is covered in the fat-burning heart rate zone; for resting energy see BMR and for the three energy measures see calories burned.
In MoveVitals
WHOOP, Garmin, Oura, Polar, COROS, Suunto, Wahoo, Withings, Apple Health, Strava and Concept2 all report energy for workouts or days in different ways. MoveVitals keeps each source's value separate, merges duplicate workouts when the same session arrives from two providers, uses your priority for the daily total and never adds two devices' calories together. If your watch and the MET estimate here differ by more than about 30 %, check the sport profile, your weight and the sensor fit before trusting either.
Worked example
Illustrative scenario. Lena weighs 68 kg. She jogs for 30 minutes at about 9.7 km/h and plays 60 minutes of social badminton. The table gives 9.8 × 68 × 0.5 ≈ 333 kcal for the run and 5.5 × 68 × 1 ≈ 374 kcal for badminton, about 705 kcal in all. Her watch shows 360 and 520 kcal, 880 in total. The run agrees within about 8 %, but the badminton figure is roughly 40 % above the table: stop-start movement and heart-rate lag push the estimate up. She plans with the table figure and watches her average weight for three weeks before changing how much she eats.
Action steps
- Look up the MET value for your activity and calculate MET × weight (kg) × hours, using the time you are actually active.
- Keep weight, age and sex up to date on every device.
- If your watch and the table differ by more than about 30 %, check the sport profile, sensor fit and heart-rate data first.
- Use a power meter for cycling; for strength and stop-start sports treat calories as rough and lean on duration, RPE and recovery.
- Judge results by your weekly average weight over 2–4 weeks, and adjust intake in small steps.
- Do not eat back every calorie your watch reports.
Related guides
- Calories burned: active, resting and total energy expenditure
- Basal metabolic rate (BMR): how many calories you burn at rest
- The fat-burning heart rate zone: myth, maths and what actually burns fat
- Heart rate zones explained: how to set and use them
- Body weight: why daily numbers jump and how to read the trend
- Nordic walking: technique, calories and heart rate with poles
- Stand-up paddling and kayaking: stroke rate, heart rate and calories
FAQ
How many calories do I burn per hour? It depends on weight and activity. For a 75 kg person, roughly 260 kcal walking at 4.8 km/h, about 410 kcal in social badminton and about 735 kcal running at 9.7 km/h. Use MET × kg × hours for your own numbers.
Which burns more calories, walking or running? Per hour, running costs roughly 2.5–3 times as much. Per kilometre the gap is smaller, roughly 1.5–2 times, because walking takes longer to cover the same distance.
Are smartwatch calories accurate? They are reasonable for steady running and walking and very good for cycling with a power meter, but weaker for strength work and stop-start sports. Treat them as estimates and compare like with like.
Why do two devices show different calories for the same workout? Each brand uses its own resting-energy formula, heart-rate model and activity profile, and some report total calories while others report only active calories.
Do fitter people burn fewer calories for the same session? Slightly, because they are more economical at a given speed. MET tables are averages, so your own cost can be a little above or below the table.
References
- Ainsworth et al. (2011). 2011 Compendium of Physical Activities: A Second Update of Codes and MET Values. Medicine & Science in Sports & Exercise. https://doi.org/10.1249/MSS.0b013e31821ece12
- Herrmann et al. (2024). 2024 Adult Compendium of Physical Activities: A third update of the energy costs of human activities. Journal of Sport and Health Science. https://doi.org/10.1016/j.jshs.2023.10.010
- Shcherbina et al. (2017). Accuracy in Wrist-Worn, Sensor-Based Measurements of Heart Rate and Energy Expenditure in a Diverse Cohort. Journal of Personalized Medicine. https://doi.org/10.3390/jpm7020003
For general information only. This is not medical advice — talk to a qualified professional about your health.
Keep reading
Metrics explained
Basal metabolic rate (BMR): how many calories you burn at rest
3 min read
Metrics explained
Calories burned: active, resting and total energy expenditure
4 min read
Devices & setup
How MoveVitals handles multiple devices: provenance, duplicates and conflicts
5 min read
Sports
Walking for fitness and weight loss: pace, heart rate zones and how much is enough
9 min read
Sports
Pickleball and your health data: heart rate zones, calories and joint load
6 min read
Devices & setup
Withings and MoveVitals: scales, blood pressure and sleep
3 min read