

Metrics explained
Fitness, fatigue and form (CTL, ATL, TSB): the performance management chart
The fitness–fatigue model turns your daily training load into three curves. It shows whether you are building, overreaching or ready to race.
Written by MoveVitals Editorial Collective
Community-authored educational content. Individual clinical review is identified only when a named review is actually recorded.
Editorial standards & corrections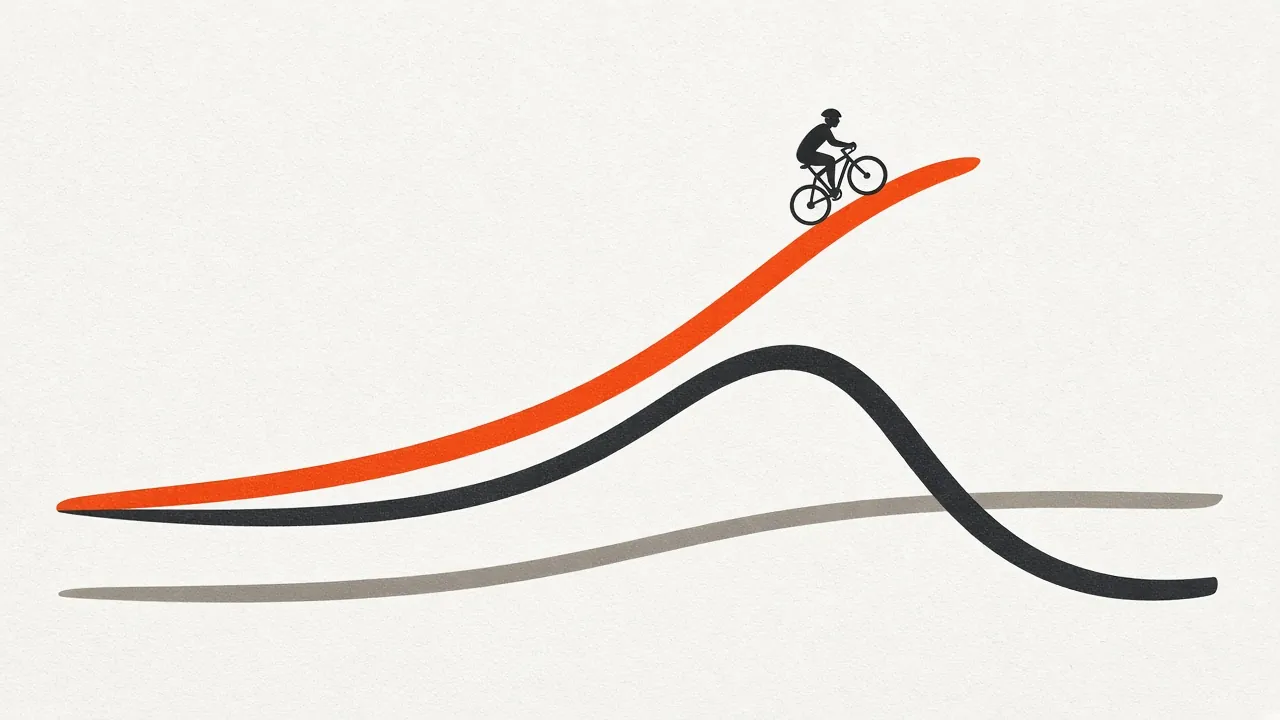
Key takeaways
- Fitness (CTL) is a roughly 42-day weighted average of training load, fatigue (ATL) a roughly 7-day average, and form (TSB) is fitness minus fatigue.
- A TSB of −10 to −30 marks a productive training block, while below −30 means a high risk of overreaching.
- Raise CTL by no more than about 5–8 points per week, and taper 7–14 days to bring TSB to roughly +5 to +25 for key races.
- Platforms show different CTL values because they use different time constants, load formulas and thresholds, so compare trends within one platform.
- TSS is built for endurance, so log strength training with RPE-based load to keep its fatigue visible.
The performance management chart (popularised by TrainingPeaks and used by intervals.icu and others) is built from daily training load:
| Curve | Also called | Calculation | Meaning |
|---|---|---|---|
| Fitness | CTL, chronic training load | ~42-day exponentially weighted average | Long-term training you've absorbed |
| Fatigue | ATL, acute training load | ~7-day exponentially weighted average | Recent stress |
| Form | TSB, training stress balance | Fitness − Fatigue | Freshness |
Reading form (TSB)
| TSB | Typical state |
|---|---|
| > +25 | Very fresh — possibly losing fitness |
| +5 to +25 | Fresh — good for races |
| −10 to +5 | Neutral, maintenance |
| −10 to −30 | Productive training block |
| < −30 | High risk of overreaching |
Ramp rate
How fast fitness (CTL) rises matters. A ramp of about 3–7 points per week is sustainable for most athletes; faster ramps increase the risk of illness and injury.
Using the model
- Build: accept negative form for 2–3 weeks while fitness rises.
- Recover: a lighter week lets fatigue fall and form recover — see deload weeks.
- Taper: before a key race, reduce volume so form rises to about +5 to +20 while fitness drops only slightly — see tapering.
Limits
The model only knows training load. It doesn't see poor sleep, illness, work stress or nutrition. Combine it with HRV, resting heart rate and how you feel.
Worked example
Worked example. An amateur cyclist has a chronic training load (CTL, fitness) of 70 TSS/day and an acute load (ATL, fatigue) of 85 after a big week, giving form (TSB = CTL − ATL) of −15: productive but tired. In the two-week taper before a race she cuts volume by about 40% while keeping short efforts. ATL falls faster than CTL, so on race day CTL is about 66 and ATL about 50, giving TSB near +16 — fresh, with most fitness kept. These numbers are an illustration; the model is a guide, not a prediction.

Action steps
- Use a consistent load metric (TSS, or heart-rate-based TRIMP) for every session.
- Raise CTL by no more than about 5–8 points per week.
- Expect TSB of −10 to −30 during build blocks.
- Taper 7–14 days to bring TSB to roughly +5 to +25 for key races.
- Cross-check the chart with HRV, sleep and how you feel.
Related guides
- Training load explained: TRIMP, TSS, strain and relative effort
- Tapering before a race: how to arrive fresh and fit
- Periodization: planning a training year
- FTP (functional threshold power): what it is and how to test it
- Team sports with a wearable: volleyball, rugby, handball and hockey load
FAQ
Is a higher CTL always better? Higher CTL means more absorbed training, but only if you stay healthy. Consistency beats spikes.
Why is my form negative all the time? That's normal in training blocks. Plan regular easier weeks.
Why do platforms show different CTL values? They use different time constants, load formulas and FTP or threshold settings; compare trends within one platform.
Does strength training count? Often it is under-represented because TSS is built for endurance; log it with RPE-based load so fatigue isn't hidden.
References
- Halson (2014). Monitoring Training Load to Understand Fatigue in Athletes. Sports Medicine. https://doi.org/10.1007/s40279-014-0253-z
- Foster et al. (2001). A New Approach to Monitoring Exercise Training. The Journal of Strength and Conditioning Research. https://doi.org/10.1519/1533-4287%282001%29015%3C0109:anatme%3E2.0.co;2
- Bosquet et al. (2007). Effects of Tapering on Performance. Medicine & Science in Sports & Exercise. https://doi.org/10.1249/mss.0b013e31806010e0
- Gabbett (2016). The training—injury prevention paradox: should athletes be training smarter and harder?. British Journal of Sports Medicine. https://doi.org/10.1136/bjsports-2015-095788
For general information only. This is not medical advice — talk to a qualified professional about your health.
Keep reading
Training science
Zone 2 training: the science and how to do it right
4 min read
Mobility & stretching
Mobility vs flexibility: what's the difference and what do you need?
3 min read
Training science
Polarized training (80/20): easy most of the time, hard some of the time
4 min read
Devices & setup
Strava and MoveVitals: workouts, streams and devices that arrive via Strava
3 min read
Training science
Interval training and HIIT: designing sessions that work
4 min read
Metrics explained
VO2 max: what it means and how to improve it
4 min read