

Metrics explained
Stress scores on wearables: what they really measure
Wearable "stress" is physiological arousal estimated from heart rate and HRV. It reacts to emotions, but also to caffeine, digestion, heat and illness.
Written by MoveVitals Editorial Collective
Community-authored educational content. Individual clinical review is identified only when a named review is actually recorded.
Editorial standards & corrections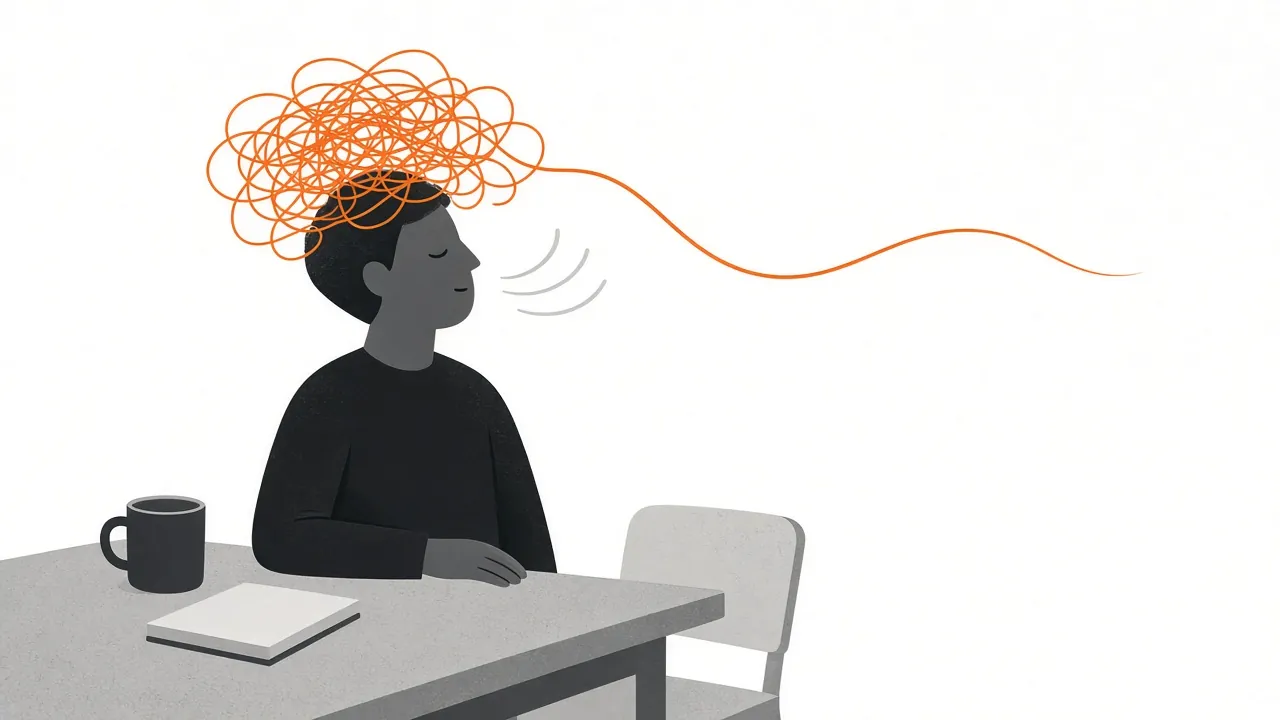
Key takeaways
- Garmin's all-day stress runs from rest at 0–25 and low at 26–50 to medium at 51–75 and high at 76–100, while WHOOP uses a 0–3 stress monitor.
- Caffeine, a big meal, alcohol, heat, illness and recovery from hard training can all raise the reading, so high stress does not always mean you feel anxious.
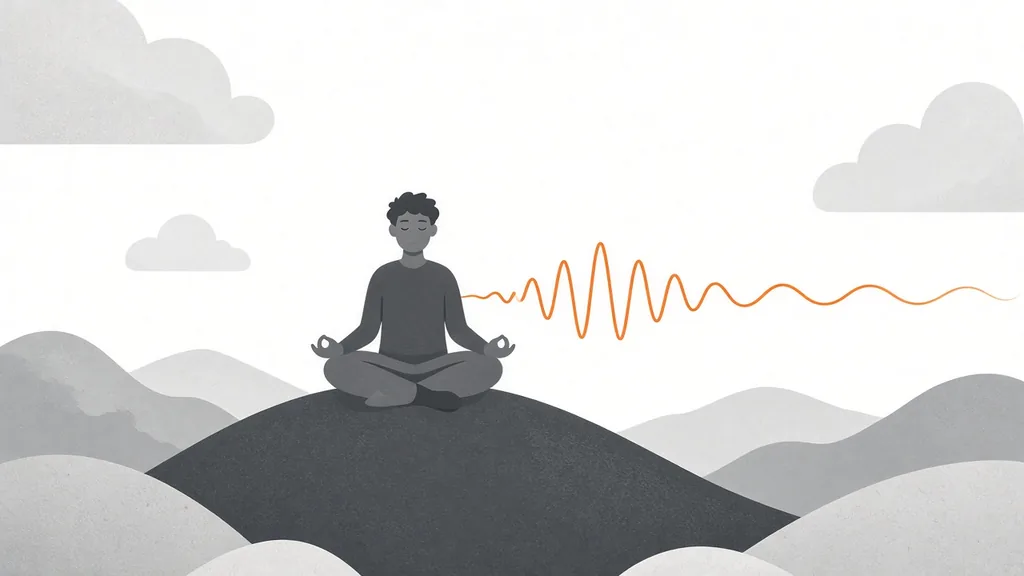
- Five minutes of slow breathing at about 6 breaths per minute lowers arousal for many people.
- Compare weekly averages rather than single readings, and talk to a health professional if high stress persists alongside poor mood or sleep.
Garmin shows an all-day stress level (0–100), WHOOP a stress monitor (0–3) and Oura a daytime stress view. All estimate the balance of your autonomic nervous system from HRV and heart rate while you are not exercising.
Garmin stress levels
| Level | Category |
|---|---|
| 0–25 | Rest |
| 26–50 | Low |
| 51–75 | Medium |
| 76–100 | High |
What raises the reading
- Psychological stress, deadlines, conflict
- Caffeine and nicotine
- Digesting a big meal, alcohol
- Heat, dehydration
- Illness and fever
- Recovering from hard training (elevated readings for hours)
So "high stress" doesn't always mean you feel anxious — it means your body is in a more aroused state.
Using it constructively
- Look for patterns: which meetings, commutes or meals drive stress up?
- Use short breathing breaks: 5 minutes of slow breathing (about 6 breaths per minute) lowers arousal for many people — see breathing and HRV biofeedback.
- Protect sleep, which is when stress levels should drop the most.
- Don't let the number become a stressor itself — see using health data without obsession.
In MoveVitals
Garmin's daily average stress is stored as its own metric alongside Body Battery. Other brands' stress values use different scales and are kept separate.
Worked example
Illustrative scenario. Lin's watch shows an all-day stress average of 42 on workdays and 25 on weekends. Peaks appear during 10:00 meetings and again after a late espresso. On one day it reads 70 while she feels calm — she had a mild cold coming on. She tries a 5-minute slow-breathing break (about 6 breaths per minute) before meetings and sees short drops in the score. She treats the number as a physiological-arousal signal, not a measure of emotion, and pairs it with how she feels. Values are illustrative and device-specific.
Action steps
- Learn what raises your score: caffeine, meetings, poor sleep, illness, heat.
- Use short slow-breathing breaks when the score spikes for long periods.
- Compare weekly averages, not single readings.
- Remember exercise and digestion also raise the stress reading.
- If high stress persists alongside poor mood or sleep, talk to a health professional.
Related guides
- Garmin Body Battery: charging, draining and what it tells you
- Normal heart rate variability (HRV) by age: RMSSD vs SDNN
- Slow breathing and HRV biofeedback: calming your nervous system
- Resting heart rate: normal ranges and what changes it
- Tai chi and qigong (Baduanjin): heart rate, balance and who benefits
FAQ
My stress was high while I was relaxed on the sofa. Possibly digestion, caffeine or recovery from training.
Is low stress always good? Generally yes at rest, but very low daytime arousal with fatigue can also accompany illness or overtraining.
Is the stress score measuring emotional stress? Not directly. It estimates autonomic arousal from heart rate and HRV, which emotions are only one cause of.
Why is my stress high while sleeping? Alcohol, late meals, illness or a hot room can keep heart rate up and HRV down overnight.
References
- Shaffer et al. (2017). An Overview of Heart Rate Variability Metrics and Norms. Frontiers in Public Health. https://doi.org/10.3389/fpubh.2017.00258
- Lehrer et al. (2014). Heart rate variability biofeedback: how and why does it work?. Frontiers in Psychology. https://doi.org/10.3389/fpsyg.2014.00756
- Task Force of the ESC and NASPE (1996). Heart Rate Variability. Circulation. https://doi.org/10.1161/01.CIR.93.5.1043
For general information only. This is not medical advice — talk to a qualified professional about your health.
Keep reading
Devices & setup
How MoveVitals handles multiple devices: provenance, duplicates and conflicts
5 min read
Metrics explained
Normal heart rate variability (HRV) by age: RMSSD vs SDNN
6 min read
Metrics explained
Resting heart rate: normal ranges and what changes it
4 min read
Recovery & sleep
Sleep hygiene: evidence-based habits for better sleep
4 min read
Recovery & sleep
Alcohol, HRV and sleep: what your wearable shows the night after
3 min read
Devices & setup
WHOOP and MoveVitals: what syncs and how to get the most from it
3 min read