

Key takeaway
Sixty adults wore seven wrist-worn devices while sitting, walking, running and cycling in a laboratory. Median heart rate error against an electrocardiogram (ECG) ran from 1.8% on the bike to 5.5% walking, but no device achieved a calorie error below 20 percent (device medians from 27.4% to 92.6%). These were consumer models on sale at the time, tested in a lab, so the results do not rank today's watches or show how they perform in daily life.
Study design
Validation study/review
Reading basis
Full text
Reading focus
Reference & error
The research question
Physical activity is among the most effective ways to lower the risk of death, yet programs to get people moving have had limited success. In weight-loss studies, simply logging food intake clearly helps, but it is less clear whether logging exercise time and calories burned does the same for health. Wrist-worn devices now hand users their own heart rate and energy expenditure estimates, patients bring that data to clinicians, and some health systems pull it straight into the medical record, yet unlike clinically approved devices these products have no public validation data. Earlier studies tested early-stage devices, looked at only heart rate or only energy expenditure, or compared devices without an FDA-approved reference, and none proposed an error model. The authors set out to measure the heart rate and energy expenditure error of seven commercial wrist devices in a deliberately diverse group of volunteers, against ECG and expired-gas calorimetry, and to propose a framework for validating consumer devices.
Who and how
This was a laboratory validation study. The authors identified 45 manufacturers and screened for wrist-worn watches or bands with continuous heart rate measurement, a stated battery life over 24 hours, direct-to-consumer sale and one device per manufacturer. Eight devices qualified; the ePulse2 was dropped after repeated technical problems in pre-testing, leaving the Apple Watch, Basis Peak, Fitbit Surge, Microsoft Band, Mio Alpha 2, PulseOn and Samsung Gear S2. Healthy adults aged 18 or older were recruited through Stanford University and local amateur sports clubs and chosen to maximize diversity in age, height, weight, BMI, wrist circumference and fitness. In total 60 people (29 men, 31 women, age 38 ± 11 years) performed 80 tests, 40 with each of two device batches (Apple Watch, Basis Peak, Fitbit Surge and Microsoft Band first; Mio Alpha 2, PulseOn and Samsung Gear S2 second), wearing up to four devices at once. Two investigators rated wrist skin tone on the Von Luschan scale, converted to the 1–6 Fitzpatrick scale, and VO2max was measured in running (32 people) or cycling (6 people) and estimated from submaximal cycling for 22. Each session started with 5 minutes seated, then treadmill walking at 3.0 and 4.0 mph, slow and faster running individualized to fitness (average 5.7 and 6.9 mph), and low and higher-intensity cycling (average work rate 88 and 160 W), ending at minute 38, with continuous 12-lead ECG and indirect calorimetry as the references.
The outcomes were heart rate against the 12-lead ECG and energy expenditure (kcal/min) against indirect calorimetry from expired gas (VO2 and VCO2), using the last minute of each stage. Error was the absolute difference from the reference divided by the reference, in percent; the authors set 5% as acceptable, by analogy with the 0.05 significance convention and precedent in pedometer step counting. Data came out of each device differently: one-minute exports for the Apple Watch, Basis Peak and Fitbit Surge, network capture of the phone app for the Microsoft Band, 3-second samples averaged over the last minute for the PulseOn, and, because the Mio Alpha 2 and Samsung Gear S2 give users no raw data, heart rate curves traced from stored app images with a plot digitizer. Results are medians with 95% confidence intervals. Group differences used two-way ANOVA with Tukey post-hoc tests and Pearson correlations with Bonferroni correction; principal component analysis, linear regression, generalized estimating equations (GEE, with the Apple Watch and sitting as reference categories), a gamma regression on root mean square error and Bland–Altman analysis looked for what drove error.
What it found
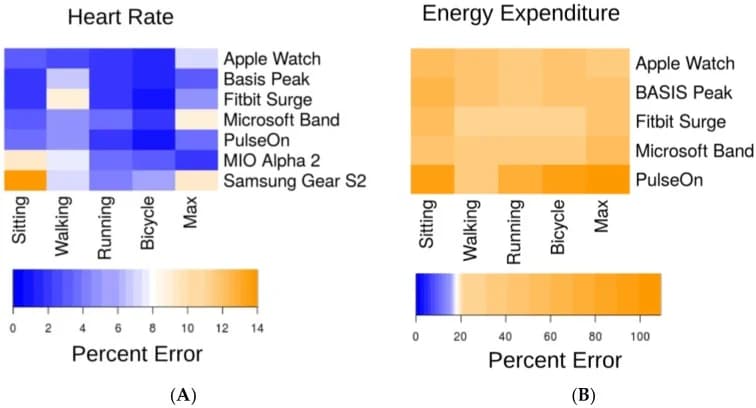
- 1Heart rate was usually close to the ECG in the lab, and best on the bike. Median error was 1.8% (95% CI 0.9%–2.7%) for cycling and 5.5% (3.9%–7.1%) for walking, the worst task; six of the seven devices were under 5% on the bike, with the Samsung Gear S2 at 5.1% (2.3%–7.9%). On walking only the Apple Watch, 2.5% (1.1%–3.9%), and the PulseOn, 4.9% (1.4%–8.6%), were under 5%; the Microsoft Band was 5.6% (4.9%–6.3%) and the other four devices fell between 6.5% and 8.8%.
- 2Calorie estimates were poor for every device and activity. Median energy expenditure error by device ran from 27.4% (24.0%–30.8%) for the Fitbit Surge to 92.6% (87.5%–97.7%) for the PulseOn, and no device achieved an error below 20 percent. Across devices, calorie error was lowest for walking, 31.8% (28.6%–35.0%), and running, 31.0% (28.0%–34.0%), and highest while sitting, 52.4% (48.9%–57.0%).
- 3The Apple Watch had the lowest heart rate error overall, 2.0% (1.2%–2.8%), and the Samsung Gear S2 the highest, 6.8% (4.6%–9.0%), across devices and activities. The abstract reports the same two devices at the two ends of the overall ranking for heart rate and calories combined.
- 4Men had higher heart rate error than women across devices. The generalized estimating equation gave P = 4.56 × 10⁻⁵ (effect size 0.044, z = 3.505), and the authors describe about a 4% higher error for men on average across devices and tasks. The same passage reports Tukey differences of means of 43.5% for the Basis Peak (ANOVA P < 1 × 10⁻⁵) and 14.7% for the Fitbit Surge (P = 0.0165), without spelling out the comparison.
- 5Body and fitness factors pointed in mixed directions. The abstract and discussion say heart rate error was higher with darker skin tone, larger wrist circumference and higher BMI across several devices, but the main text gives no skin-tone numbers (they are in supplementary tables), and for the Apple Watch while running, BMI (t = −2.78, P = 0.009), weight (t = −2.53, P = 0.016) and wrist size (t = −2.71, P = 0.01) were negatively associated with error. Higher VO2max went with more error while walking on the Microsoft Band (t = 2.25, P = 0.03) and the Basis Peak (t = 2.34, P = 0.025).
- 6Activity type and intensity shaped heart rate error, and no one person was consistently badly measured. Error was lower for running than walking but higher at higher intensity within each type of exercise, and the authors found no evidence that particular individuals had systematically higher error across tasks or devices.
Limits & uncertainty
- 1The authors note that they tested only the devices and algorithms available at the time, in a laboratory, and that the real value of wearables lies in continuous monitoring outside the clinic, which they leave to future work. Firmware and algorithm updates since this 2017 paper could change any device's numbers.
- 2Our observation: each device's data were obtained differently. Some were minute exports, one was captured from phone-app traffic, two were traced from stored images with a digitizer, and one was averaged from 3-second samples. That adds error that has nothing to do with the sensor, and devices were tested in two separate batches of 40 tests with up to four worn at once.
- 3Our observation: error was computed as an absolute percentage, so it cannot show whether a device reads too high or too low, and the 5% line is the authors' own choice rather than a clinical requirement. Only the last minute of each stage was analyzed, which says little about how devices follow quickly changing effort.
- 4Our observation: the main text has inconsistencies. The walking results say three devices were below 5% but list the Microsoft Band at 5.6%; the male-versus-female P value is 4.56 × 10⁻⁵ in one paragraph and 4.56 × 10⁻⁴ in another; the abstract names the Samsung Gear S2 as highest in both measures although the PulseOn had the highest calorie error (92.6%). The finer subgroup statements deserve caution.
- 5Our observation: 60 healthy volunteers recruited from a university and amateur sports clubs, chosen to be diverse, are not a random sample. With 29 men and 31 women, seven devices, several activities and many covariates, the sex, BMI and VO2max findings are exploratory, and the study did not test people with heart or other conditions.
What to take from it
For steady exercise, the wrist heart rate from these devices was usually close to an ECG reference, with median errors of only a few percent on the bike, close enough to tell an easy session from a hard one. Calories are a different matter: median energy expenditure errors of 27.4% to 92.6% by device mean the number is a rough, relative guide, not something to balance a diet against, which fits the authors' caution about using calorie estimates in health improvement programs.
Do not conclude that any brand is best or worst today. These were older models, and software updates since could change the picture. Do not carry the heart rate result over to intervals, heart rate variability or sleep, none of which were tested, and an accurate heart rate does not make a watch's other metrics accurate. This is solid laboratory evidence in healthy adults, not proof of everyday accuracy.
Reading your own data
To see how your own device behaves, do one steady 5-minute effort on a bike or treadmill while also wearing an ECG-type reference such as a chest strap, and compare the last minute, which is how the study did it; expect larger gaps walking than cycling. Use calorie numbers only as a trend within the same device and the same type of activity over weeks, never to compare brands, and do not average calories from different devices. Fit, which wrist you wear it on and the device's own minute-by-minute averaging can all shift readings.
How to read this evidence
Agreement is specific to the device, firmware, reference, population and setting. Correlation is not agreement, and validating a metric is not proof of diagnostic or treatment benefit.
Sources & attribution
Accuracy in Wrist-Worn, Sensor-Based Measurements of Heart Rate and Energy Expenditure in a Diverse Cohort
Journal of Personalized Medicine · 2017-05-24
DOI: 10.3390/jpm7020003 ↗PubMed · 28538708 ↗MoveVitals editorial interpretation · educational content · no individual clinical review recorded
Sources checked 2026-11-01
Practical guides
Read in context
Activity–stroke and heart attack curves differ by accelerometer processing method
Among 90,237 UK Biobank adults free of cardiovascular disease at baseline, followed until December 2022 for 1,298 strokes and 2,031 myocardial infarctions, the shape of the link between moderate-vigorous physical activity (MVPA) and each outcome depended on how the accelerometer data were processed. For stroke, hazard fell in a straight line only with the machine-learning metric; for myocardial infarction, two metrics gave a curved decline and activity counts a straight one. The abstract gives no hazard ratios, so it shows that methods disagree, not which one is right, and the findings are observational associations.
Preventive Medicine
Smartwatch data as forensic evidence: heart rate is best validated, the rest uneven
A systematic review and meta-analysis of studies on smartwatches from four major brands, framed around digital forensics, found that heart rate was both the most studied and the most accurate measure. Step count, distance, energy expenditure, activity classification and sleep were less consistently validated, and results varied by brand, protocol and reporting. The abstract gives no pooled numbers, and most studies were run in healthy people in laboratories, so it cannot say how a particular watch performs for a particular person in daily life.
Forensic Science International
Activity trackers: about 1,800 more steps a day, but small effects on other outcomes
An umbrella review of 39 systematic reviews and meta-analyses, covering 163,992 participants, found that activity trackers were associated with more physical activity (SMD 0.3–0.6), equating to about 1,800 extra steps and 40 minutes more walking per day, and with a bodyweight reduction of about 1 kg. Effects on blood pressure, cholesterol, glycosylated haemoglobin, quality of life and pain were typically small and often non-significant. The abstract does not say what else came with the trackers in these programs or how much the reviews overlap, so the gains cannot be credited to the device alone.
The Lancet Digital Health
Seven sleep trackers: good at spotting sleep, weak on wake and sleep stages
In a sleep laboratory, 34 healthy young adults wore a subset of seven consumer sleep trackers for three nights. Against polysomnography every device detected sleep very well (sensitivity 0.93 or higher) but caught wake poorly (specificity 0.18–0.54), and five of the seven matched or beat research actigraphy (specificity 0.39). Sleep-stage estimates were inconsistent, and the participants were healthy adults aged 18 to 35 in a fixed 8-hour bed window, with each device tested in only 11 to 20 of them, so the results say little about people with sleep problems.
Sleep