

À retenir
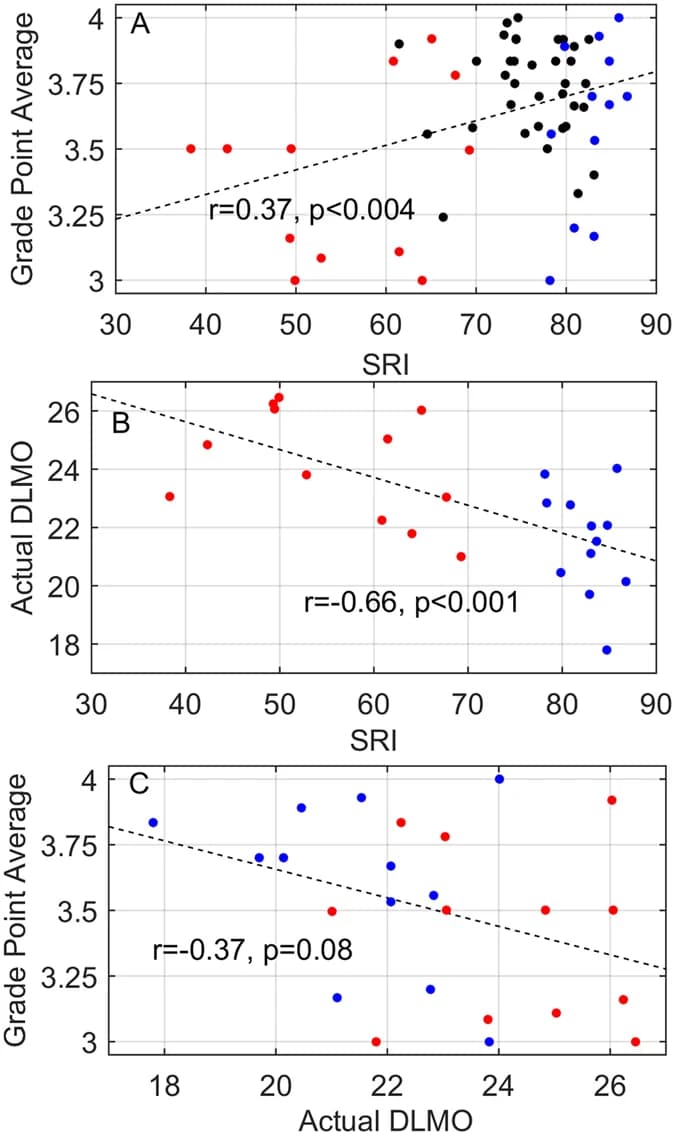
Among 61 Harvard undergraduates tracked for about 30 days, the most irregular sleepers had melatonin onset at 00:08 versus 21:32 in the most regular sleepers (p < 0.003), and sleep regularity correlated with grade point average (r = 0.37, p < 0.004). The sample was small and the design observational, so the data cannot show that irregular sleep lowers grades or shifts the body clock.
Study design
Étude de cohorte
Reading basis
Full text
Reading focus
Association & confounding
Cette explication éditoriale existe en anglais, chinois simplifié et chinois traditionnel. Cette interface affiche la lecture en anglais.
Question de recherche
Short sleep is linked to slower thinking, accidents and metabolic and psychiatric disease, but the authors argue that sleep has other dimensions, including how steady the schedule is. People who keep shifting their sleep also shift their pattern of light and dark, and because the body clock adjusts slowly, sleep and the clock can drift out of step. Earlier regularity measures need a main nightly sleep episode, which many students lack because of naps and all-nighters, so the team built the Sleep Regularity Index (SRI): the percentage probability of being in the same state, asleep or awake, at two moments 24 hours apart, scored 100 for an identical routine and 0 for a random one. The study asked whether SRI relates to melatonin timing, light exposure and grades over one semester, and whether a computer model of the body clock could show if light patterns alone explain any timing difference.
Population et méthode
This was an observational cohort study at Harvard College in autumn 2013. Full-time undergraduates aged 18 or older (first-years excluded) were recruited regardless of class schedule; pregnant students and anyone travelling more than 1 time zone were excluded. Of 63 who enrolled, 2 dropped out in the first week, leaving 61 students living in campus housing (32 men, 29 women, aged 18–24, 20.23 ± 1.27). They kept an online sleep diary for about 30 days (26–36 days, mean 30.67), logging sleep onset, waking, awakenings, naps and watch removals; each diary opened for only 24 hours after waking, staff checked entries daily, and sleep/wake state was known for 95% of the study. After 14 days the team ranked students by SRI and invited the top fifth (12 ‘Regular’ sleepers) and bottom fifth (12 ‘Irregular’ sleepers) to wear a wrist actiwatch that logged light every minute for about one week and to give hourly saliva samples in dim light on a Friday night near the end of the study. Students did not know which group they were in.
The main outcome was dim-light melatonin onset (DLMO), the clock time at which saliva melatonin first crosses 5 pg/mL, a standard marker of body-clock timing. Other outcomes were sleep timing and light patterns from the diary and actiwatch, baseline questionnaires (Pittsburgh Sleep Quality Index and the Morningness-Eveningness Questionnaire), and self-reported grade point average (GPA) after the semester, available for 59 students. The primary grade analysis was the Pearson correlation between SRI and GPA, with a group comparison as a secondary analysis. Groups were compared with the Wilcoxon rank-sum test unless the data were clearly normal, then a two-tailed t-test; the final SRI used the longest whole-week stretch without missing data (4 weeks for 43 students). To ask why the groups differed, the authors fed each student’s light record into a previously validated mathematical model of the human circadian pacemaker with default settings, meaning no built-in difference in clock biology, and compared predicted with measured DLMO. The paper reports simple correlations and group comparisons rather than adjusted models.
Résultats
- 1The most irregular sleepers had a body clock that ran later. Melatonin onset averaged 00:08 ± 1:54 in the Irregular group versus 21:32 ± 1:48 in the Regular group (p < 0.003, 12 students each), and the daily peak of sleep propensity came at 06:33 ± 0:19 versus 04:45 ± 0:11 (p < 0.005). Among students with DLMO measured, a higher SRI went with earlier melatonin onset (r = −0.66, p < 0.001); the authors compare the gap to travelling 2 to 3 time zones west.
- 2Higher regularity went with higher grades. Across 59 students SRI correlated with GPA (Pearson r = 0.37, p < 0.004), and each 10-point rise in SRI went with an average GPA 0.10 higher. Comparing only the 12-student groups chosen at the midpoint, GPA was 3.41 ± 0.33 (Irregular) versus 3.60 ± 0.32 (Regular), which was not significant (p = 0.16); regrouping with the full 30-day record gave 3.42 ± 0.34 versus 3.72 ± 0.24 (p < 0.02). Morningness-Eveningness score did not predict GPA (r = −0.01, p = 0.96), and DLMO was not significantly correlated with GPA (r = 0.37, p = 0.08).
- 3Total sleep was the same; its timing was not. Average daily sleep was 7.16 ± 0.64 h in the Irregular group versus 7.27 ± 0.59 h in the Regular group (p = 0.68), SRI was unrelated to sleep duration across all students (r = 0.05, p = 0.71), and duration was unrelated to GPA (r = 0.12, p = 0.37). Irregular sleepers slept less during the clock night, 22:00 to 10:00 (5.01 ± 0.91 h versus 6.61 ± 0.44 h, p < 0.0002), and made it up by day with 3.02 ± 1.47 naps per week versus 0.75 ± 0.80 (p < 0.002) and 5.35 ± 2.82 h versus 0.72 ± 0.65 h of compensatory daytime sleep per week (p < 0.0005). Regular sleepers were asleep 55% of the clock night and 1% of the clock day, Irregular sleepers 42% and 11%.
- 4Irregular sleepers lived with a flatter light–dark cycle. The amplitude of their daily light rhythm was 102 ± 19 lux versus 179 ± 29 lux in Regular sleepers (p < 0.005), daytime light was lower (128 ± 84 lux versus 207 ± 92 lux, p = 0.03), and relative to their own average they received more light during the biological night (p = 0.001). Light timing itself was not clearly later: the centroid of light exposure was 14:18 ± 2:37 versus 13:05 ± 1:19 (p = 0.18), though its spread across individuals was much wider (9.6 h versus 4.5 h).
- 5A light-only model reproduced most of the delay, but mainly on average. Using default physiology and each student’s light record, the model predicted a DLMO 1.7 h later in the Irregular group (p < 0.01), against an observed delay of 2.2 h. For individuals the fit was looser: predictions fell within ±1 h of the measured DLMO for 4 of 11 Regular and 5 of 10 Irregular students, and within ±2 h for 9 of 11 and 8 of 10.
- 6The result did not depend on the SRI alone, though the measures are not interchangeable. SRI correlated with the standard deviation of sleep onset time (r = −0.66, p < 10−8), wake time (r = −0.62, p < 10−7) and mid-sleep time (r = −0.62, p < 10−7), and GPA correlated with the same three measures (r = −0.43, p < 0.001; r = −0.29, p = 0.02; r = −0.31, p < 0.02). Between the two groups the standard deviation of mid-sleep time did not differ significantly (1.64 ± 0.64 h versus 0.99 ± 0.26 h, p = 0.053).
Limites et incertitude
- 1The authors state that the findings cannot establish causation: sleep regularity may be a stand-in for regularity in other parts of daily life, and they acknowledge that group differences in clock physiology may exist alongside the light effect the model captured. The model result is an inference about mechanism, not a test in which light was changed.
- 2The authors note that melatonin was measured on only one night per student, so individual timing may not be stable, especially for irregular sleepers; this could explain why model predictions tracked individuals less closely in the Irregular group (r = 0.34, slope 0.26) than in the Regular group (r = 0.50, slope 0.31). One Irregular student never settled into a stable pattern in the model and could not be predicted.
- 3The authors point out that napping to make up lost night sleep may be specific to undergraduates living on campus, because most full-time workers cannot do it, and that the study was not powered to test sex differences or to control for menstrual-cycle phase.
- 4Our observation: the extreme-group comparisons rest on 12 students per group at one selective university, and the 59 GPAs were self-reported. The group difference in GPA was not significant for the groups used to select students for testing (p = 0.16) and became significant only when groups were redefined from the full 30-day record (p < 0.02). Grades at this school are bunched near the top of the scale (recent median GPA estimated at 3.64 out of 4.00).
- 5Our observation: sleep timing came from self-completed diaries, not a worn sensor, and only the light and melatonin data were measured objectively. The model’s melatonin-release timing was set so that its average predicted DLMO matched the data, which fixes the overall clock time but leaves the group gap to be tested.
Mise en perspective
The reasonable takeaway is that steadiness and duration are separate things: students with almost the same average sleep ranged from highly regular to highly irregular schedules (SRI 38 to 86). If your sleep and wake times swing from day to day, that also swings your light and dark exposure, and in this sample the pattern that went with later melatonin timing was dim days and relatively more light at night. Bright daytime light and a consistent routine are reasonable things to try, but this study did not test whether they help.
It does not show that irregular sleep lowers grades, that a regular schedule will raise yours, or that a score is a measure of effort or ability. The grade link was moderate (r = 0.37) and came from one campus, and students who sleep irregularly may differ in many other ways. The authors themselves say that whether imposing a regular schedule improves sleep, health and performance needs an experiment. Treat this as a well-measured but small hypothesis-generating study.
Vos données
Look at bedtime and wake-time consistency across weeks, not only the nightly hours; the study used up to 4 weeks of data per student. Some wearables report a regularity or consistency score, but it is usually not the SRI, which compared minute-by-minute asleep/awake states 24 hours apart and counted naps, so stick to one device and follow your own trend. Naps matter here: a steady-looking night can hide daytime compensation. Travel, exam weeks and illness will move the numbers, and a wrist light sensor or phone brightness reading is not the calibrated device the study used.
Comprendre ce type de preuve
Exposure precedes follow-up outcomes, but confounding and reverse causation can remain. A hazard ratio is not an individual absolute risk or a demonstrated intervention effect.
Sources et attribution
Irregular sleep/wake patterns are associated with poorer academic performance and delayed circadian and sleep/wake timing
Scientific Reports · 2017-06-12
DOI: 10.1038/s41598-017-03171-4 ↗PubMed · 28607474 ↗Interprétation éditoriale MoveVitals · contenu éducatif · aucune évaluation clinique individuelle enregistrée
Sources vérifiées 2026-11-01
Guides pratiques
À lire ensemble
Exercise improved sleep-quality scores in adults 45 and older with sleep disorders
Pooling 23 randomized trials with 1,478 adults aged 45 to 77 who had sleep disorders, exercise improved Pittsburgh Sleep Quality Index scores (SMD 0.62, 95% CI 0.40–0.83), and aerobic exercise showed the largest effect in the network analysis (SMD 1.34, 95% CrI 0.86–1.82). Certainty was low to moderate, the outcomes were questionnaires, and the best weekly dose of about 539 MET-min/week is a model estimate, not a prescription.
Journal of Exercise Science & Fitness
Sleep regularity tracked mortality more closely than sleep duration in 60,977 UK adults
Among 60,977 UK Biobank adults who wore a wrist accelerometer for a week, the most regular fifth of sleepers had a fully adjusted all-cause mortality HR of 0.70 (95% CI 0.59–0.83) against the least regular fifth, over about 6.3 years and 1859 deaths. Regularity fitted the data better than sleep duration, but the study is observational and rests on one week of sleep data.
Sleep
Sleep extension cut daily energy intake by about 270 kcal in adults with overweight
In 80 adults with overweight who usually slept under 6.5 hours, two weeks of sleep-extension counselling added about 1.2 hours of sleep and lowered measured energy intake by 270.4 kcal/d versus control (95% CI −393.4 to −147.4). The trial was short, single-centre and in a narrow group, so it does not show lasting weight loss or any benefit for people who already sleep enough.
JAMA Internal Medicine
Six hours or less of sleep at 50 and 60 linked to higher dementia risk
In 7959 British civil servants followed for about 25 years, sleeping six hours or less at age 50 (HR 1.22, 95% CI 1.01–1.48) or age 60 (HR 1.37, 1.10–1.72) was linked to a higher dementia rate than sleeping seven hours, and persistent short sleep gave an HR of 1.30 (1.00–1.69). Sleep was mostly self-reported and the study is observational, so early brain disease or other factors may explain part of the link.
Nature Communications